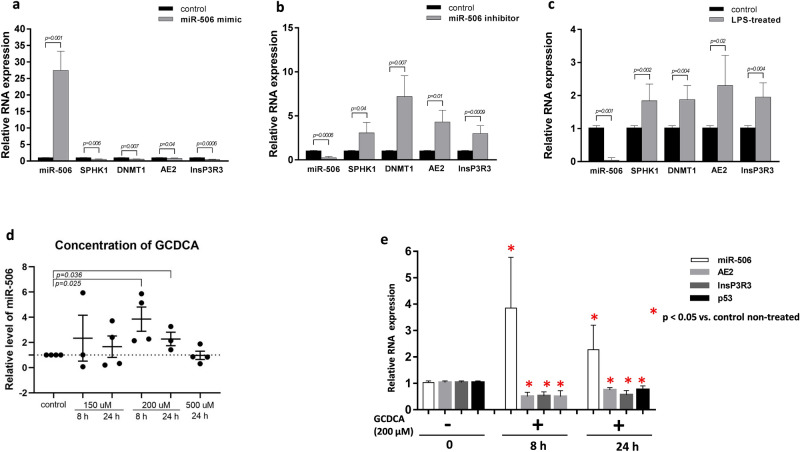
Figure 4.
Effects of miR-506 induction and inhibition in Caco-2 cell line. (a) Relative expression levels of sphingosine-kinase-1(SPHK1), DNA-methyltransferase-1(DNMT1), anion exchange protein 2 (AE2), and inositol-1,4,5-trisphosphate-receptor (InsP3R3) mRNA after induction of miR-506 by 48-h transfection with mirVana miR506 Mimic (grey bars: cells transfected with miR-506 Mimic; black bars: control non-transfected cells). (b) Inhibition of miR-506 by 48-h transfection of Caco-2 cells with mirVana miR506 Inhibitor led to significant upregulation of SPHK1, DNMT1, AE2 and InsP3R3 mRNA levels. (grey bars: cells transfected with miR-506 inhibitor; black bars: control non-transfected cells). (c) Lipopolysaccharide (LPS)-induced inflammatory response reduced miR-506 expression and enhanced SPHK1, DNMT1, AE2 and InsP3R3 expressions. (d) The effect of glycochenodeoxycholic acid (GCDCA) on miR-506 expression in Caco-2 cells. Dots illustrate each experiment (n = 3–4) and lines the mean plus interquartile range (IQR).The dotted line represents control values. (e) GCDCA-induced miR-506 expression suppressed levels of AE2, InsP3R3 and p53 mRNAs both after 8-and 24-h exposure to GCDCA (200 µM). Each experiment was repeated three or four times with similar results. Relative data normalized to endogenous reference genes (miRNA-191 or 18S rRNA) are presented as the mean ± standard error (SE). Statistics: one-way ANOVA followed by Fisher’s PLSD test within the groups *indicates p-value < 0.05 vs. non-treated controls.

