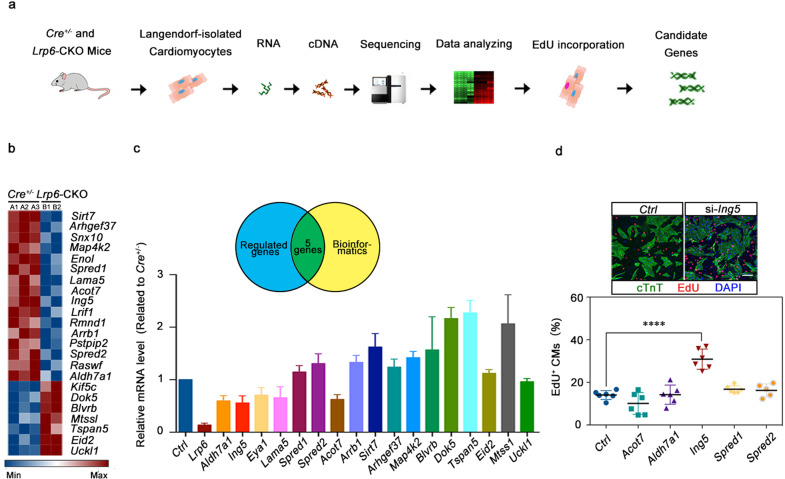
Fig. 5. ING5 is the downstream of LRP6 in cardiomyocyte proliferation regulation.
a Total RNA-seq diagram and b heatmap showing the most differentially regulated genes in the Cre+/− and Lrp6-CKO cardiomyocytes (CMs) as identified by RNA-seq analysis. Red and blue represent up- and down-regulated genes, respectively. n = 2–3 mice per group. c Verification of the expression of genes identified by RNA-seq in the Cre+/− and Lrp6-CKO cardiomyocytes (CMs). The Venn diagram shows five genes that were revealed by RNA-seq and bioinformatics analysis to be highly correlated with cell cycle regulation. n = 4 mice per group. d Immunostaining showing the incorporation of EdU in control (Ctrl) and si-Ing5-treated NRCMs. The results represent 5–6 experiments. Scale bar = 50 μm. The column shows the percentage of proliferating NRCMs after silencing the Acot7, Aldh7a1, Ing5, Spred1, and Spred2 genes in NRCMs. ****P < 0.0001. Data are presented as means ± SD.

