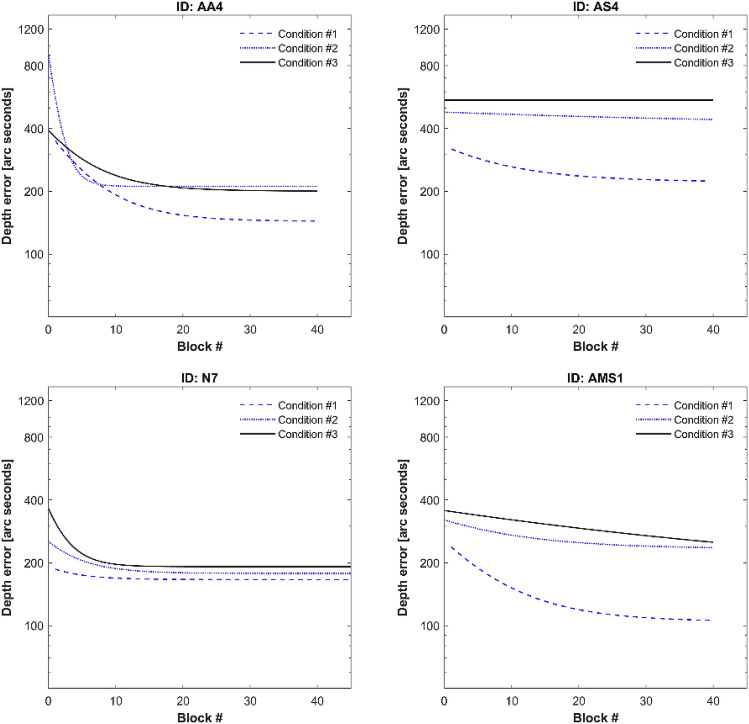
Figure 4.
Across-block learning in four participants. From upper left to bottom right: AA4, stereo-anomalous anisometric; AS4, stereo-anomalous strabismic; N7, stereo-normal; AMS1, stereo-anomalous with micro strabismus. Each graph shows the exponential fit of the end-block depth error in the three conditions: Condition 1, blue dashed line; Condition 2, blue dotted line; Condition 3, dark continuous line. Although N7 performed 60 blocks of training, only first 45 blocks are represented to facilitate comparison.

