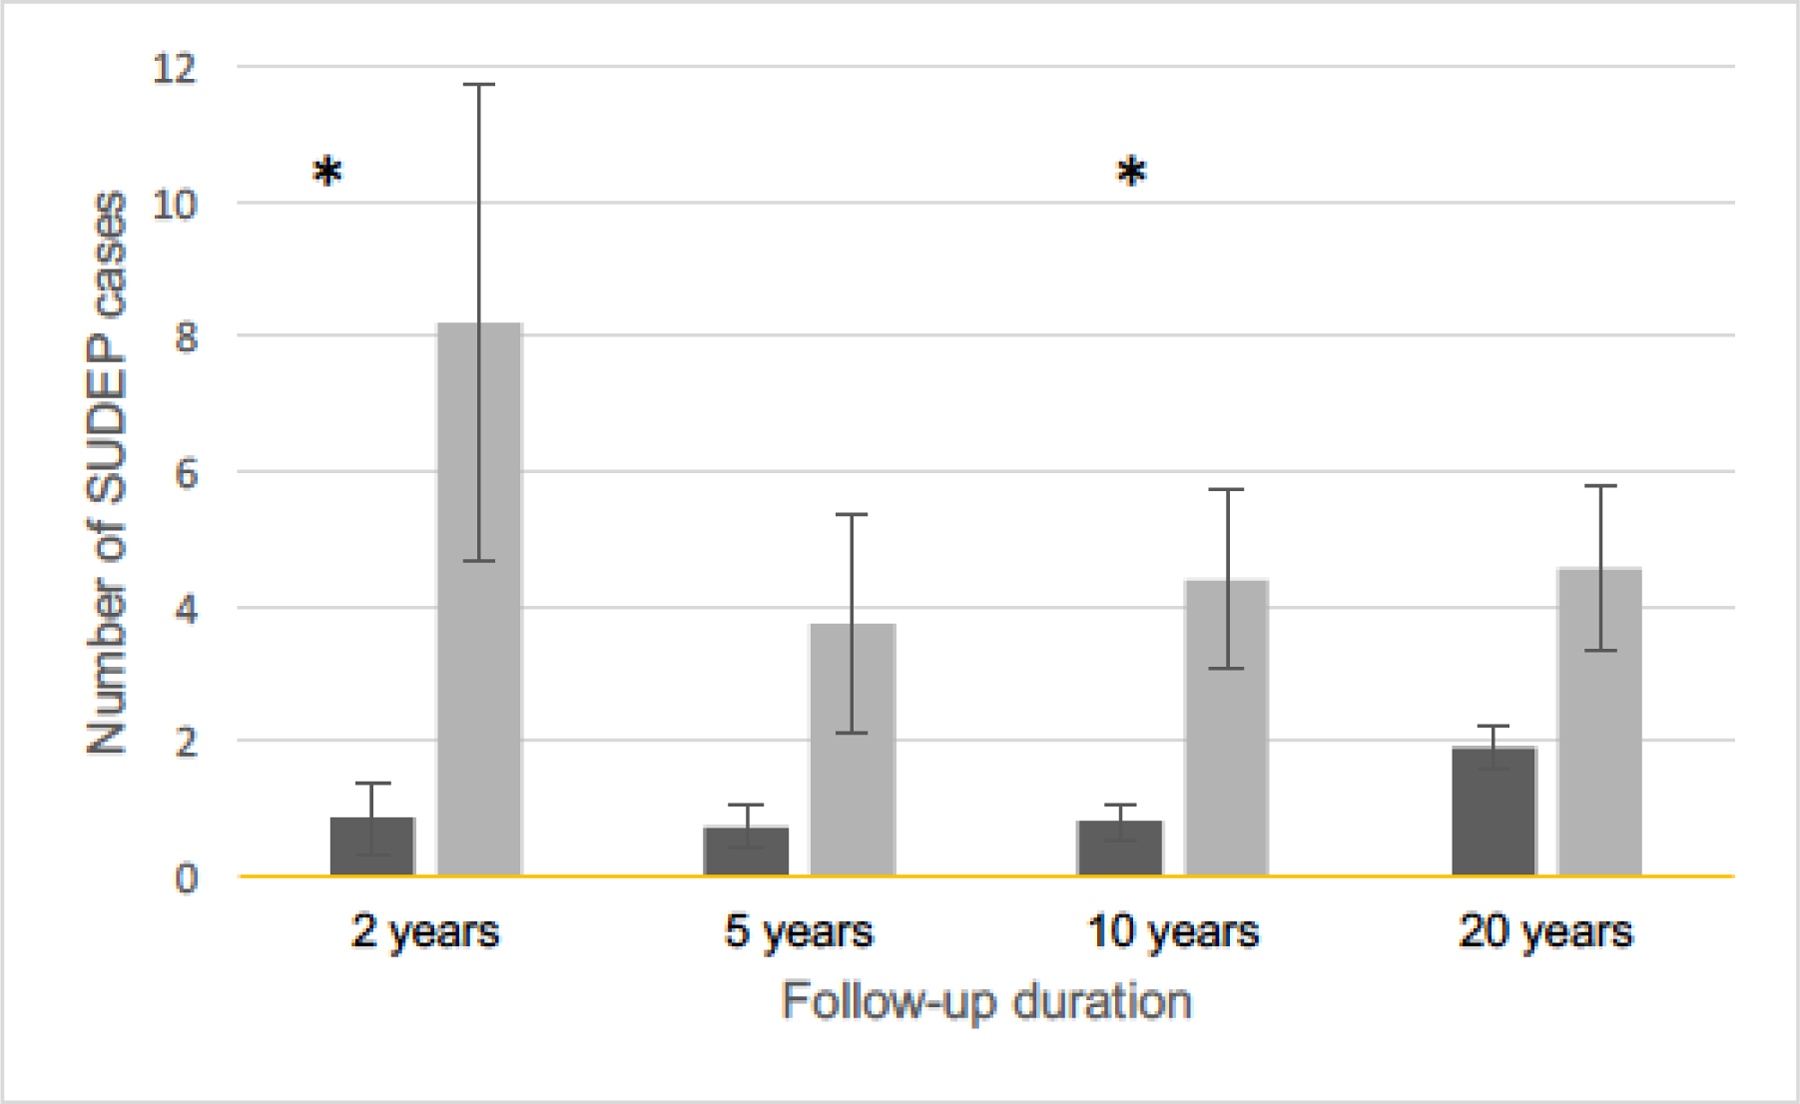
Figure 1:

Comparison of SUDEP rates between groups over time. SUDEP rates=deaths/1000 patient-years and 95% confidence intervals over time in the surgery (dark grey) and comparison (light grey) groups. The rate in the surgery group is notably low and stable through 10 years of follow up, then rises after the 10-year mark. The SUDEP rate in the comparison group is immediately higher and remains relatively stable across the entire follow up period. The difference between SUDEP rates in the surgery and comparison groups are significant at 0–2 years (cases: 1156.6 patient-years and 3 SUDEP deaths, comparison group 237.7 patient-years and 2 SUDEP deaths, chi-square test, p=0.01) and 5–10 years (cases: 7371.7 patient-years and 14 SUDEP deaths, comparison group 1096 patient-years and 5 SUDEP deaths, chi-square test, p=0.04) after Bonferroni correction (asterisks).
