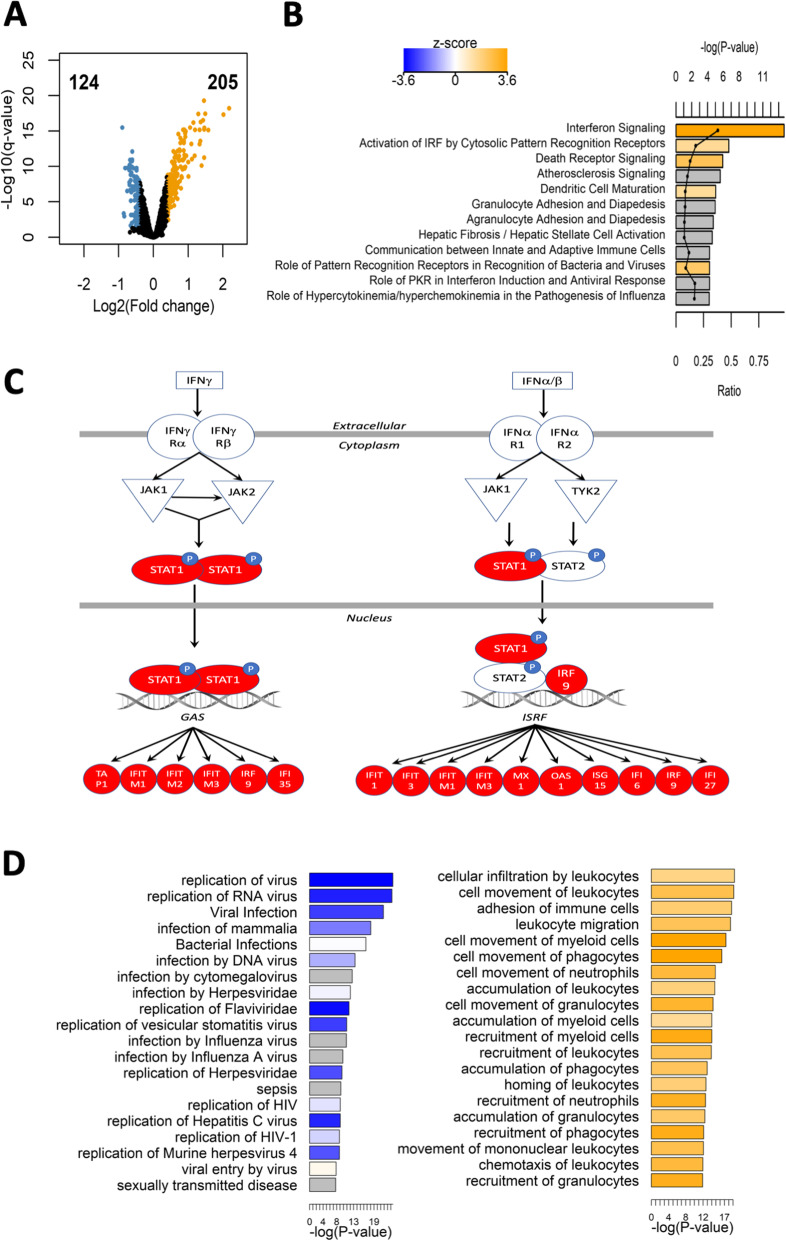
Fig. 1.
Echinaforce® induced gene expression activates innate immunity pathways a Volcano plot showing the upregulated genes (orange color, number of probes: 205), and downregulated genes (blue color, number of probes: 124) upon treatment of THP1 cells for 48 h with Echinaforce® tincture (1%). b Top enriched IPA canonical pathways. Bars are colored by activation z-score. c IPA interferon signaling pathway with Echinaforce®-induced upregulated genes colored in red and green, respectively. d Top enriched IPA infectious diseases and IPA immune trafficking disease and biological function. Bar charts are colored by activation z-score

