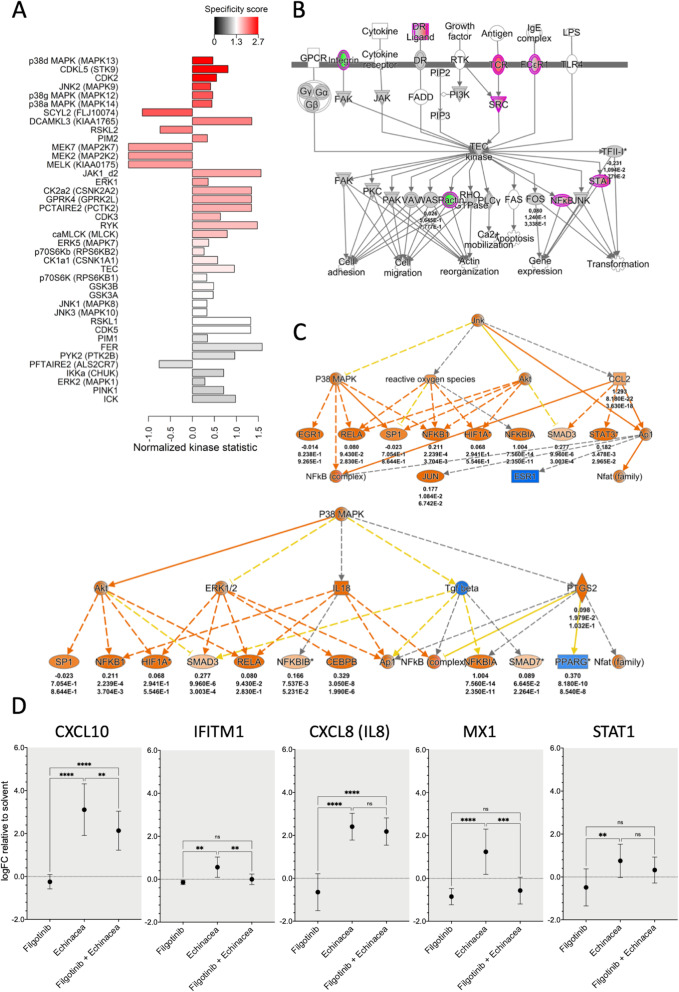
Fig. 5.
Activation of JAK1 and MAPK kinases by Echinaforce®. a Kinome activity profiling on THP1 cell lysates, following 15 min treatment with Echinaforce® tincture (1%). Showing predicted upstream kinases. Bars are colored by specificity score with red meaning the highest score. The direction of the bars represents the normalized kinase statistics. A positive kinase statistic means a higher activity in Echinaforce® treated samples. b TEC signaling pathway as predicted by IPA software showing the up- and down-regulated genes (colored in red and green, respectively), after Echinaforce® treatment. Numbers under genes names represent (from up to down): the log fold changes, p-values and adjusted p-values after a paired t-test comparing gene expression in cells stimulated with Echinaforce® and solvent (control). c) IPA-enriched P38 MAPK and JNK pathways upstream regulators. Genes colored in orange are predicted to be activated, while genes colored in blue are predicted to be inhibited. Numbers under gene names represent (from up to down): the log fold changes, p-values and adjusted p-values after a paired t-test comparing gene expression in cells stimulated with Echinaforce® and solvent (control). d Effect of JAK1 inhibition on transcript expression of interferon pathway related genes. THP1 cells were either treated during 48 h with the JAK1 inhibitor Filgotinib alone or in combination with Echinaforce® (n = 7). Mean expression LogFC change relative to solvent control is represented together with 95% confidence interval. *: P ≤ 0.05, ** P: ≤ 0.01, *** P: ≤ 0.001

