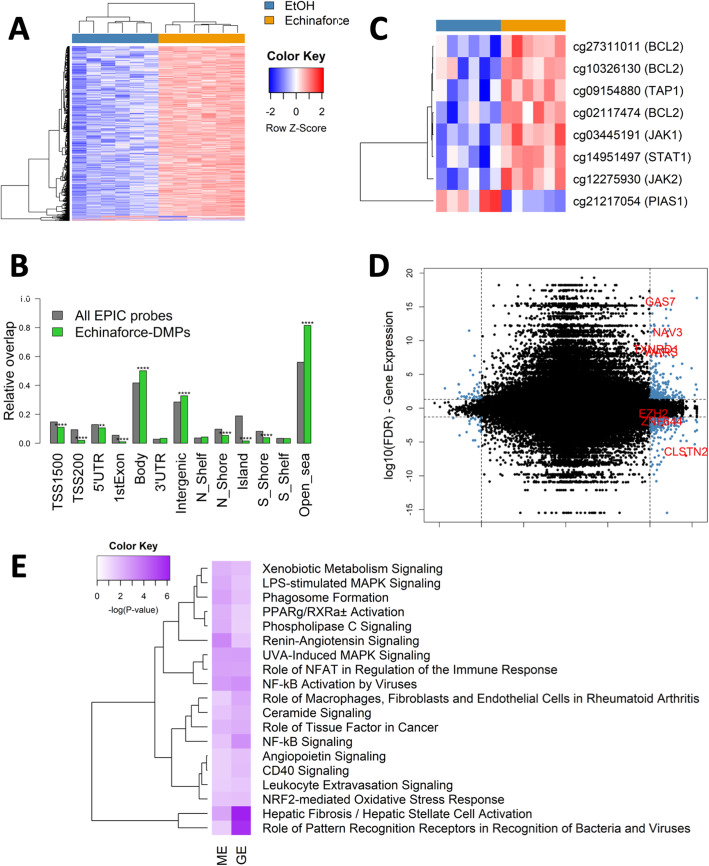
Fig. 6.
Echinaforce® treatment leads to global hypermethylation of CpG-poor gene bodies. a Heatmap showing the methylation values of differentially methylated probes upon treatment of THP1 cells for 48 h with Echinaforce® tincture (1%). Solvent (EtOH) controls are colored in blue and Echinaforce®-treated cells in orange. b Genomic enrichment of DMPs in different genomic regions. c CpG probes located in genes of the interferon signaling pathway which were differentially methylated (FDR < 0.1). * P ≤ 0.05, ** P ≤ 0.01, *** P ≤ 0.001, **** P ≤ 0.0001. d Starburst plot showing the genes both differentially expressed and differentially methylated. Each CpG-probe was mapped to its corresponding gene and the -log10(FDR) from the gene expression and DNA methylation analysis is displayed. The –log10(FDR) values of genes or CpG-probes with a negative LogFC or delta beta was multiplied by − 1 leading to positive values when logFC or delta beta was positive and negative values when logFC or delta beta was negative. CpG-probe – gene pairs which were differentially expressed (FDR < 0.05) and differentially methylated (FDR < 0.1) were colored in blue. The CpG-probe – gene pairs of which the absolute delta beta was higher than 0.05 and the absolute logFC higher than 0.4 were colored in red. e The IPA canonical pathways which were both significantly enriched in the gene expression and DNA methylation analysis

