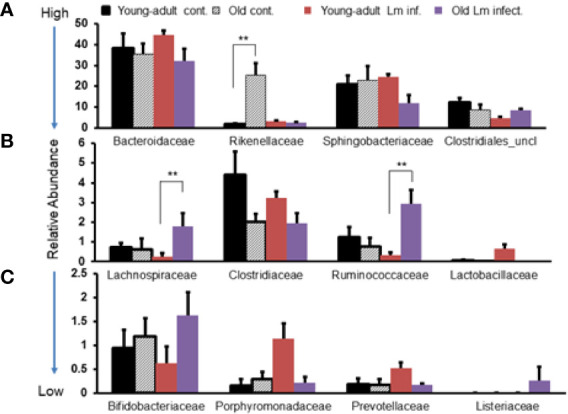
Figure 3.

Comparative representation of relative abundance of fecal microbiota at the family level in young-adult and old mice before and after Listeria monocytogenes infection. (A) Showing high abundance bacteria (>10%) at the family level. (B) Intermediate abundance level (<6%) bacteria at the family level. (C) Low level (<2%) bacteria at the family level. Taxonomic composition for the abundant bacteria at the family level was generated from k-mer analyses based on taxonomic profiling. Data from mean ± SEM from a representative experiment using 4–6 mice. **p < 0.01.
