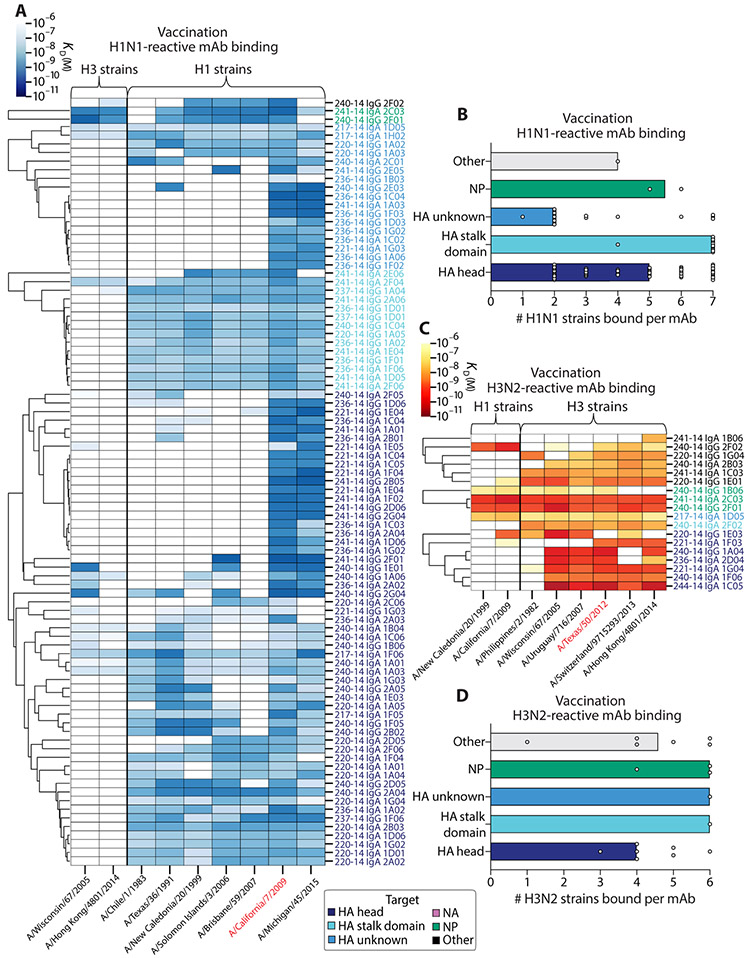
Fig. 5. The degree of influenza virus vaccination–induced antibody cross-reactivity is influenced by antigen reactivity and vaccine strain reactivity.
(A and B) The viral binding breadth of H1N1-reactive quadrivalent vaccine-induced mAbs is represented by heatmap analysis displaying affinity (KD) to contemporary and historical H1N1 and H3N2 whole viral strains (A) and bar graphs summarizing the number of homosubtypic H1N1 viral strains bound per H1N1-reactive mAb (n = 90), subset by antigen specificity (B; bars indicate median). (C and D) The viral binding breadth of H3N2-reactive quadrivalent vaccine-induced mAbs is represented by heatmap analysis displaying affinity (KD) to contemporary and historical H3N2 and H1N1 whole viral strains (C) and bar graphs summarizing the number of homosubtypic H3N2 viral strains bound per H3N2-reactive mAb (n = 18), subset by antigen specificity (D; bars indicate median). Heatmap data are depicted as ELISA binding affinity (KD) values for each individual mAb tested against the respective viruses, and antigen reactivity of each mAb is indicated by the color coding in the legend. For both heatmaps, the strains colored in red text represent the vaccinating strains present in the vaccines at the time of mAb isolation. Data are representative of two to three independent experiments performed in duplicate.

