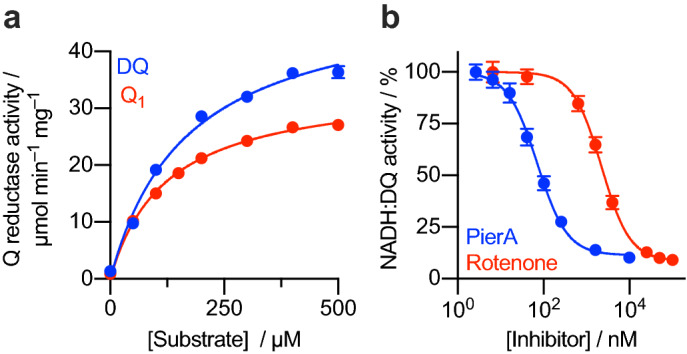
Figure 3.

Characterization of purified complex I from P. denitrificans. (a) KM curve for DQ and Q1 substrates for a typical sample of soluble complex I. The KM values for DQ and Q1 are 169 ± 15 and 124 ± 8 µM, respectively (± S.E. of the fit). (b) Piericidin A and rotenone IC50 titration curves for soluble complex I, using DQ as the substrate. The IC50 values of piericidin A and rotenone are 72 ± 7 nM and 2226 ± 185 nM, respectively (± S.E. of the fit).
