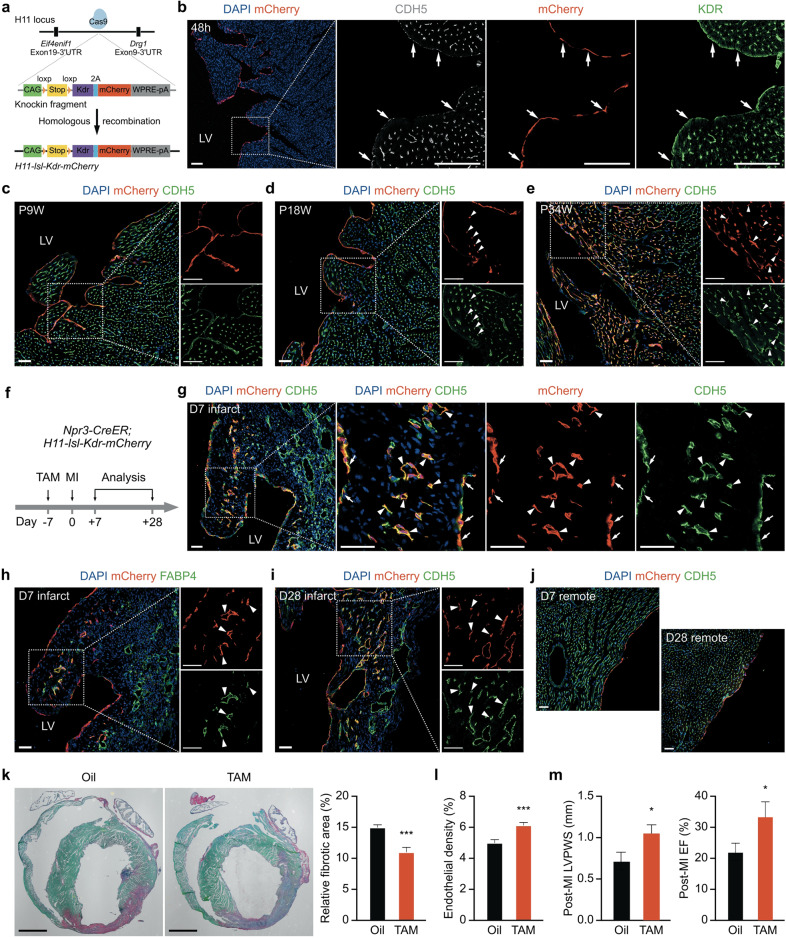
Fig. 1. Adult endocardium with Kdr-overexpression generates coronary VECs in homeostasis and post-MI.
a The strategy for generating H11-lsl-Kdr-mCherry mice. b mCherry, CDH5 and KDR staining on heart sections from Npr3-CreER;H11-lsl-Kdr-mCherry mice that were harvested at 48 h after tamoxifen treatment at P8W. The arrows indicate KDR+ endocardium. c–e mCherry and CDH5 staining on heart sections from Npr3-CreER;H11-lsl-Kdr-mCherry mice at the indicated time points after tamoxifen administration at P8W. The triangles indicate mCherry+ coronary VECs. f Experimental strategy for tracing Kdr-overexpressed adult endocardium during MI using Npr3-CreER;H11-lsl-Kdr-mCherry mice. g, h mCherry and CDH5 or FABP4 staining on heart sections from Npr3-CreER;H11-lsl-Kdr-mCherry mice at day-7 post-MI. The arrows indicate mCherry+ endocardium. The triangles indicate mCherry+ coronary VECs. i mCherry and CDH5 staining on heart sections from Npr3-CreER;H11-lsl-Kdr-mCherry mice at day-28 post-MI. The triangles indicate mCherry+ VECs. j Few endocardial-derived coronary VECs were identified in the remote regions at day-7 or day-28 post-MI. k Sirius red staining showing that the relative fibrotic area (fibrotic area/ventricular area) was reduced in the Kdr-overexpressed group at day-7 post-MI. n = 7 mice for each group. l The endothelial density (endothelial area/infarct area) in the infarct regions was increased in the Kdr-overexpressed group at day-7 post-MI. n = 3 mice for each group. m Left ventricular posterior wall thickness at end systole (LVPWS) and ejection fraction (EF) were improved at day-7 post-MI in the Kdr-overexpressed group. n = 9 for the oil group; n = 6 for the TAM group. *P < 0.05. LV, left ventricle; RV, right ventricle. White scale bars, 50 µm; Black scale bars, 2 mm. Boxed regions are magnified on the right.

