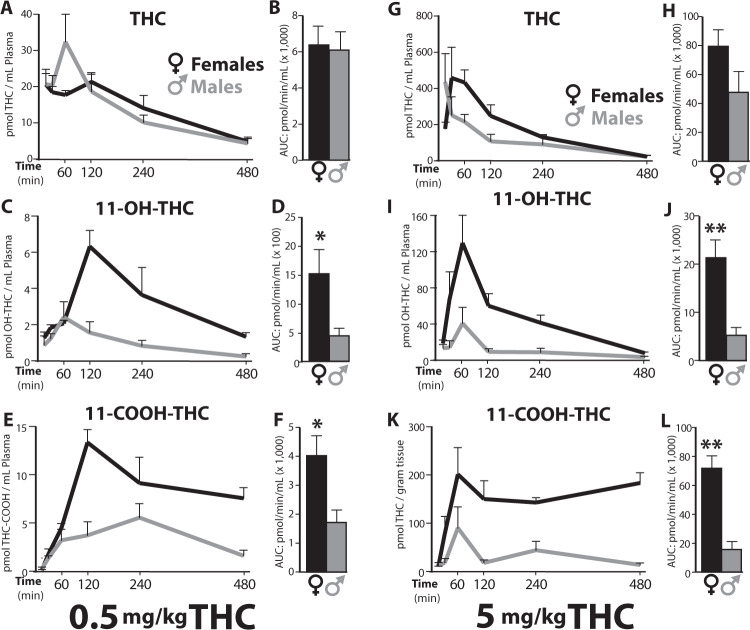
Fig. 1. Plasma concentrations of THC and its first-pass metabolites.
Concentration profile of THC, 11-OH-THC, and 11-COOH-THC in plasma after IP injection of THC, 0.5 mg/kg (left panel: a–e) or 5 mg/kg (right panel: g–l), in female (black) or male (gray) adolescent rats. Lines represent the mean ± SEM, n = 4/sex and dose group at each timepoint (15, 30, 60, 120, 240, 480 min post THC). Adjacent bar graphs represent total exposure (area under the curve, AUC, pmol/min/mL) to THC, 11-OH-THC and 11-COOH-THC, respectively, in females or males after 0.5 mg/kg (b, d, f) or 5 mg/kg THC (h, j, l). Bars represent the mean ± SEM, *p < 0.05, **p < 0.01.

