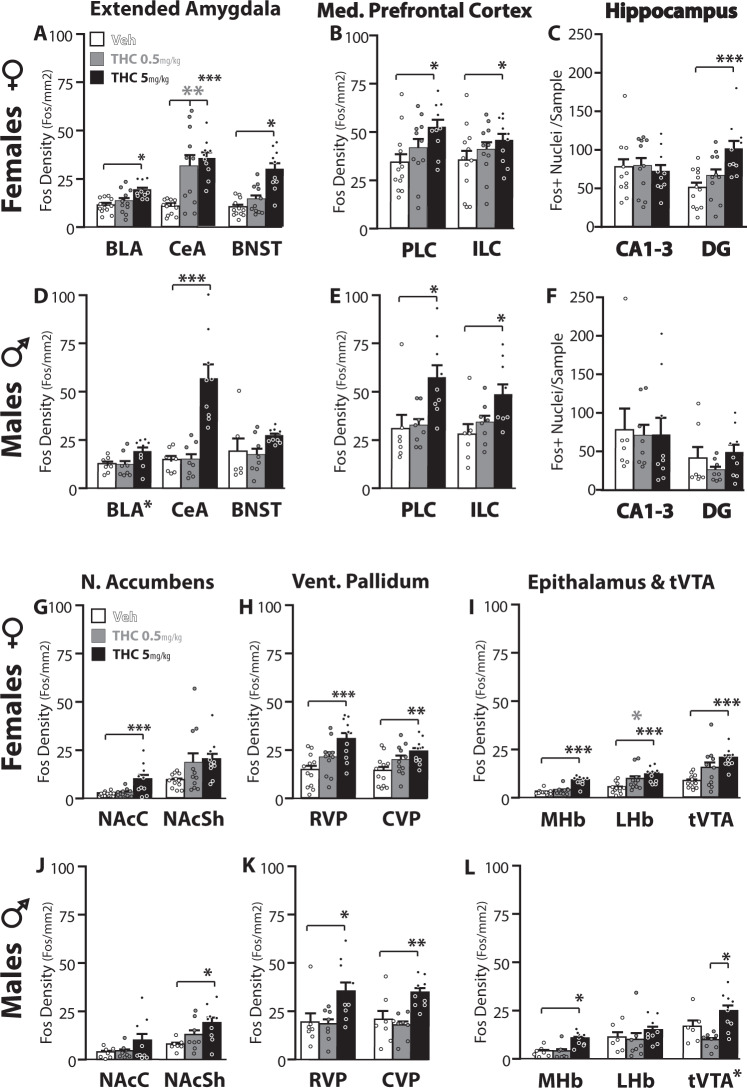
Fig. 4. THC effects on c-Fos expression.
In females (a–c; g–i), THC dose-dependently induced Fos immunoreactivity in several structures, as indicated by *symbol under bars that significantly differ from vehicle in that structure. Vehicle-treated rats = white bars, 0.5 mg/kg THC rats = gray bars, 5 mg/kg THC rats = black. Individual rat data is represented with dots. In males (d–f; j–l), data are represented using the same scheme. *p < 0.05, **p < 0.01, ***p < 0.001 as indicated, or adjacent to structure name in Dose main effect without significant post-hoc. BLA basolateral amygdala, CeA central amygdala, BNST bed nucleus of the stria terminalis, PLC prelimbic medial prefrontal cortex, ILC infralimbic mPFC, CA1-3 cornus ammoni regions 1-3, DG dentate gyrus, NAcC/NAcSh nucleus accumbens core/shell, RVP/CVP rostral/caudal ventral pallidum, MHb/LHb medial/lateral habenula, tVTA tail of the ventral tegmental area.

