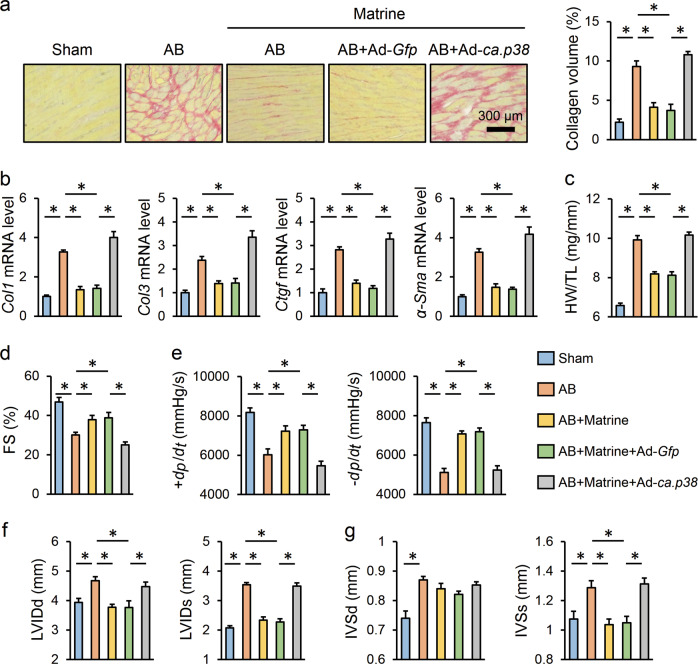
Fig. 4. Matrine prevented fibrotic remodeling and cardiac dysfunction by suppressing p38 in the mice.
a Representative images of PSR staining and the statistical results (n = 6). b The relative mRNA levels of Col1, Col3, Ctgf, and α-Sma among groups (n = 6). c Statistical result of HW/TL (n = 8). d–g Echocardiography and hemodynamic analyses for FS, ±dp/dt, left ventricular end diastolic/systolic dimension (LVIDd/LVIDs) and interventricular septal thickness at diastole or systole (IVSd/IVSs) (n = 8). Values represent the means ± SEM. *P < 0.05 versus the matched group.

