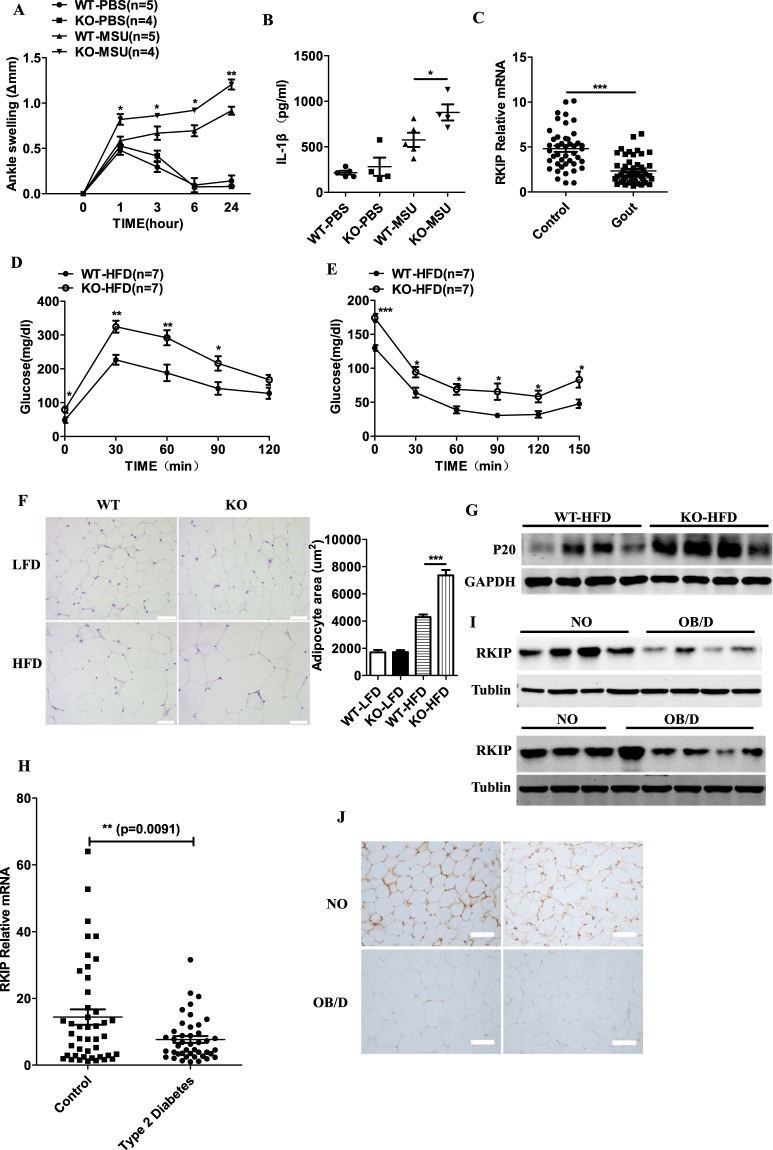
Fig. 6.
RKIP is involved in the development of NLRP3 inflammasome-related diseases. a, b The WT and Rkip-KO mice were injected with MSU (0.5 mg) in the ankle to induce inflammation. Time course of changes in MSU-induced ankle swelling of the WT and Rkip-KO mice was performed (a), and ELISAs of IL-1β (24 h later) (b) in ankle culture from the WT and Rkip-KO mice were performed (n = 4–5 mice per group). c Quantitative PCR analysis of RKIP expression in peripheral blood samples from gout patients (n = 49) and control subjects (n = 44). Glucose tolerance tests (GTTs) (d) and insulin tolerance tests (ITTs) (e) of the WT and Rkip-KO mice after HFD feeding for 24 weeks (n = 7 mice per group). f Hematoxylin and eosin (H&E) staining of VAT from the WT and Rkip-KO mice after LFD or HFD feeding for 24 weeks on the left (scale bars, 100 µm). The size of 20 randomly selected adipocytes in 10 randomly selected images was analyzed, and the quantification of adipocyte size is shown on the right. g Immunoblotting analysis of caspase-1 (P20) levels in the VAT of the LFD- or HFD-fed WT and Rkip-KO mice. h Quantitative PCR analysis of RKIP expression in peripheral blood samples of the control subjects (n = 44) and the T2D patients (n = 43). i Immunoblotting analysis of RKIP expression in omental adipose tissue samples from the NO subjects (n = 7) and the OB/D patients (n = 9). j Representative immunohistochemical staining for RKIP in omental adipose tissue samples from the NO subjects (n = 4) and the OB/D patients (n = 4) (scale bars, 100 µm). Error bars represent SEM for (a, d, e), data are the mean ± SEM (b, c, h) and are representative of two independent experiments. Student’s t test was used for statistical calculation. *p < 0.05; **p < 0.01; ***p < 0.001

