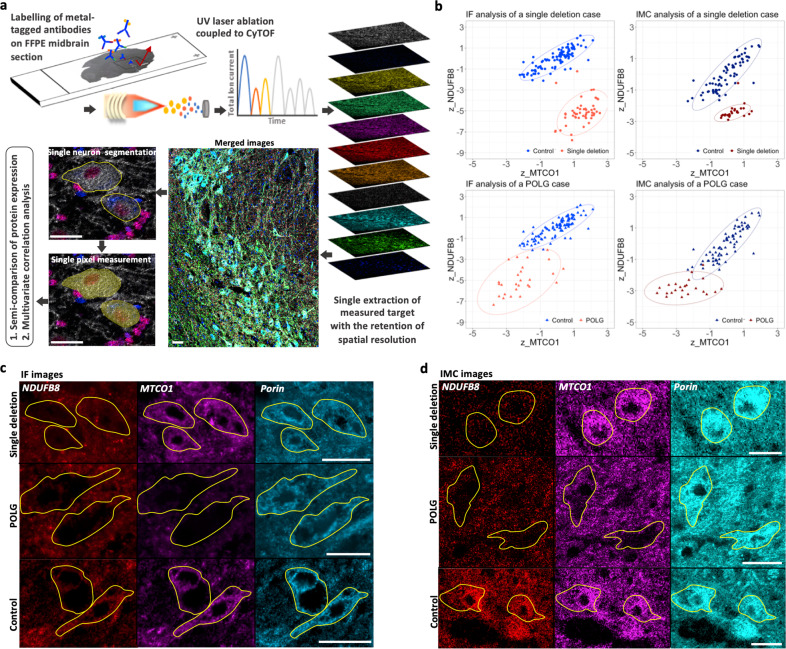
Fig. 1. Workflow and validation of imaging mass cytometry (IMC) assay on human post-mortem midbrain.
a A schematic demonstration of the IMC experimental workflow to investigate protein expression in individual midbrain neurons. Formalin-fixed, paraffin-embedded (FFPE) midbrain sections (5 µm) were immuno-labelled with twelve Lanthanide-metal-conjugated antibodies. Regions of interest within the substantia nigra (SN) region were ablated under a pulsed 213 nm UV laser beam, ionised and accelerated via an inductively coupled plasma source (ICP) of the “cytometry by time of flight” (CyTOF). Ion currents from each metal tag were detected as a signal intensity, reflecting the abundance of specific target proteins and assembled with spatial information into images. Individual tyrosine hydroxylase (TH)-positive dopaminergic neurons were manually outlined, with the single pixels within each outline automatically segmented. The mean signal intensity for only the cytoplasmic pixels per outlined neuron was calculated for further statistical analysis. b Validation of IMC profiling of mitochondrial oxidative phosphorylation (OxPhos) protein expression in the SN neurons by comparison to immunofluorescent (IF) data. Neurons from a mitochondrial disease case harbouring a single, large-scale mitochondrial DNA (mtDNA) deletion (red; female, 40 years) previously found to have an isolated complex I deficiency, and a patient with POLG mutations (dark red; male, 59 years, POLG03 in the cohort) which showed deficiencies in both complex I and IV (Chen et al7.). The z score data for complex I (z_NDUFB8) and complex IV (z_MTCO1) expression (normalised to VDAC1 expression) generated from both IF and IMC were plotted and compared to the same control cases (blue; 66 years and 73 years, male) respectively. The 95% confidence ellipse was also illustrated for each dataset. c, d Example images from IF and IMC. Individual neurons (outlined) negative for NDUFB8 and positive for MTCO1 from the single deletion case, are shown alongside neurons negative for both NDUFB8 and MTCO1 in the patient with POLG mutations, and both signals were normal in neurons from the control cases. Scale bar, 50 µm.

