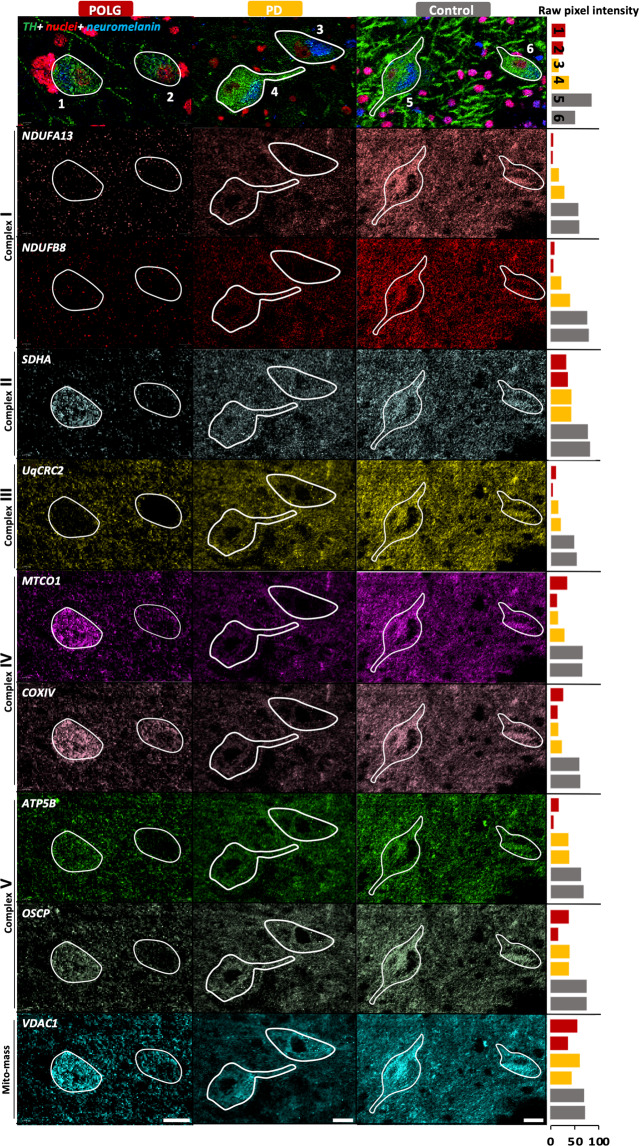
Fig. 2. IMC images of TH-positive SN neurons.
The signal from eight OxPhos complex subunits and a mitochondrial outer membrane protein (VDAC1) as mitochondrial mass marker were pseudocoloured to highlight mitochondrial protein expression. Representative images were selected from POLG02 (female, 23 years), PD02 (male, 70 years) and Con01 (female,18 years). Nuclei (red) are labelled by a Histone H3 antibody, neuromelanin (NM, navy) is visualised via the signal from Ir-intercalator binding. Each individual neuron was outlined based on TH-positive staining and intracellular presence of a nucleus and NM signal. Bar charts include to the right of each row of images illustrate the comparison of the raw mean pixel intensity per neuron, and the numbers on the bars refer to the neuronal number in the corresponding images (red-POLG; yellow-PD; grey-control). Scale bar, 20 µm.

