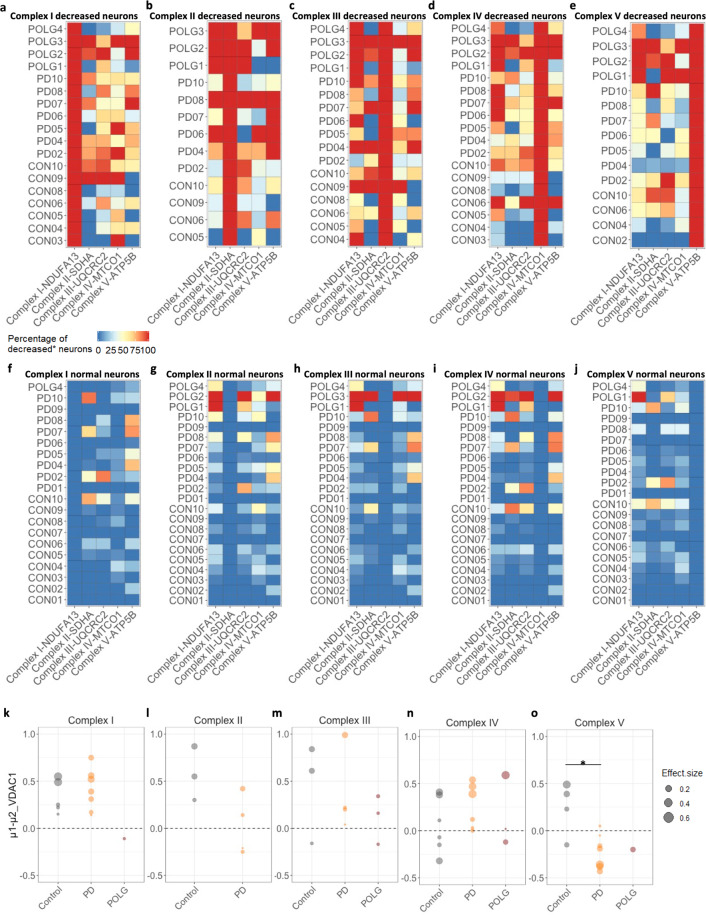
Fig. 6. Complexity of OxPhos deficiencies within Substantia nigra neurons.
a–e Heatmaps to illustrate the percentage of neurons which show a decreased level of protein expression within each individual complex among the five categories of deficient neuronal populations (complex I–V deficient neurons respectively). f–j These are shown alongside the same percentage calculations within the corresponding normal neuronal populations. Cases with no deficient neurons were excluded from this analysis. k–o Using Bayesian estimation, the difference of means (µ1–µ2; µ1-decreased, µ2-normal) of mitochondrial mass (VDAC1) between the decreased and normal neurons of each individual case was analysed and compared between groups. Only cases with three or more neurons which fell into each category were included. Group comparison of the µ1–µ2 value of each individual was also performed (Mann–Whitney test, *p < 0.05). Dot sizes represent the values of the effect size.

