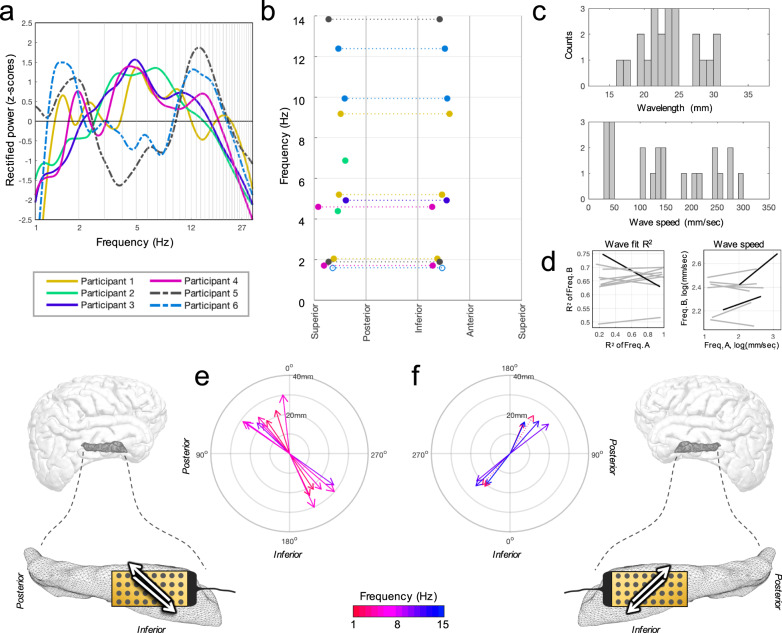
Fig. 2. Propagating hippocampal oscillations among all participants.
a Rectified power spectra as channel means for each participant. Awake participants (left-sided; dotted lines) appeared to have stronger power in delta and alpha ranges while theta appeared stronger in anesthetized patients (right-sided). b Direction versus frequency among all participants with consolidated anatomic orientation. Dotted lines connect each bidirectional frequency (open circles: n.s., Hodges-Ajne test). c Distributions of wavelengths (top) and speeds (bottom) for all modal directions averaged across baseline periods. d Least squares lines (gray) are shown for Spearman correlations of wave fit (R2, left panel) and speed (right panel) for any two frequencies in the same participant (9 possible combinations; see Supplementary Table 3). Significant combinations (black; >99% CI) were uncommon. e TW predominant directions (arrows) for all uni- and bidirectional instances among right-sided participants (color: center frequency, length: wavelength). Supero-posterior and infero-anterior directions predominated, depicted as white arrows in the adjacent schematic (connector orientation in black). f Similar for left-sided participants, appearing anatomically mirrored between the hemispheres (compare to (e)).

