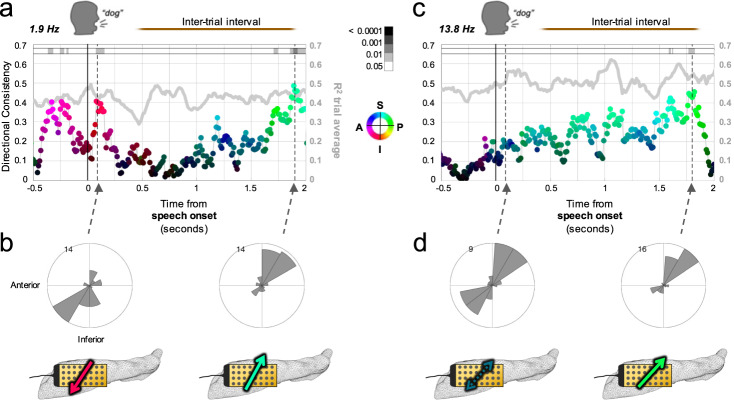
Fig. 4. Alignment of propagation direction during inter-trial intervals.
a Directionality consistency (DC; dots) values for the 1.9 Hz peak frequency in Participant 5 (n = 43 trials) locked to speech onset similar to Fig. 3b (same scale bars and direction color wheel), but extending 2 s into the inter-trial interval (gray line: mean R2 across trials with separate y-axis at right; shaded region: DC 95% CI for shuffled timepoints). After speech onset, the alignment across trials toward the temporal pole recedes and then reemerges, but aligned more toward the septal pole as the subsequent trial approaches. b Directional distributions for two example timepoints (dotted lines in (a), pFDR = 0.0243 and 0.0087, respectively, Rayleigh), illustrating the direction reversal. Bottom, anatomic schematics (left hippocampal microgrid, arrow color same as (a)) conveying average direction of wave travel over hippocampal surface at those timepoints. c Same as a for the 13.8 Hz frequency, with a low DC around speech onset (though usual quadrants predominate) followed by a steady increase in alignment more toward the septal pole as the subsequent trial approaches. d Directional distributions and schematics for two example timepoints marked by the dotted arrows in (c) (pFDR = 0.4583 and 0.0189, respectively, Rayleigh).

