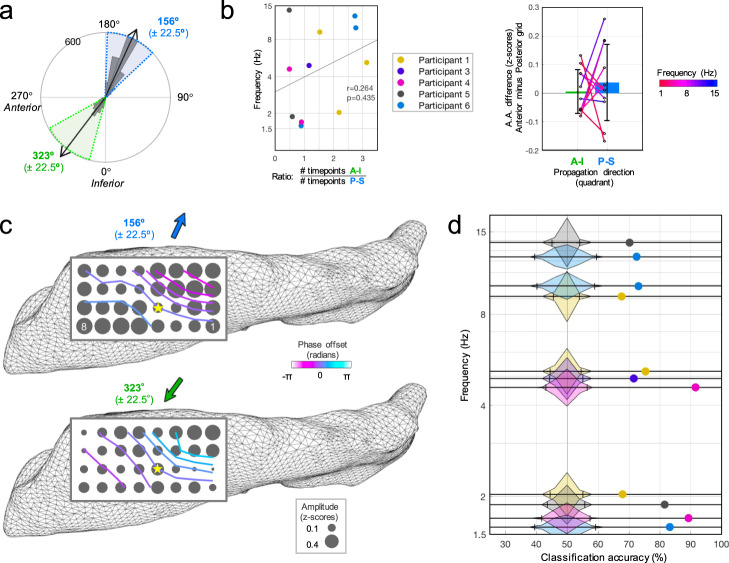
Fig. 5. Topographic pattern of oscillation strength predicts propagation direction.
a Example of angle split procedure for the distribution of bimodal TW timepoints (Participant 5, 13.8 Hz oscillation). Timepoints having wave directions within a 45° spread of either mode were grouped into separate conditions. b Across participants, the frequency (n = 11) of a predominant (peak) oscillation did not predict whether it tended to propagate toward the temporal or septal pole more often, assessed by the ratio of total timepoints in each direction condition (left panel; p = 0.44, Spearman correlation, A-I: antero-inferior direction, P-S: postero-superior direction). Analytic amplitude (A.A.) differences between the anterior and posterior halves of the grid for these same frequencies (colored lines; compiled across participants) were not different between the two directions (right panel; p = 0.57, two-sided paired t-test; mean ± standard deviation). c Average channel amplitudes (dot size: mean z-score) across all timepoints split by condition, for example, frequency in (a), suggestive of distinct surface activity topography for each propagation direction. Contour lines overlaid are interpolated estimates of phase gradient offsets (circular mean across all condition timepoints) along the surface relative to electrode #12 (yellow star). d Probability density envelopes (10,000 iteration shuffled distributions, 4% bins) for SVM model classification accuracy among all peak frequencies across participants (chance: 50%, hatch marks: 99% CI) and actual/observed values (colored dots; see legend in (b)).

