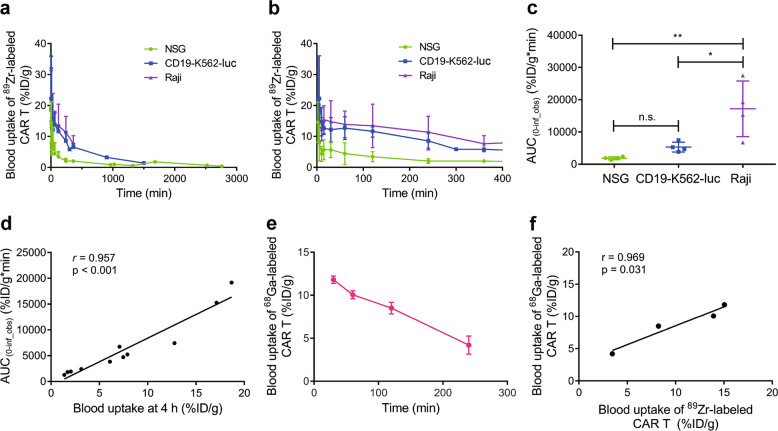
Fig. 5. Pharmacokinetics of radiolabeled CAR T cells.
PK curve of 89Zr-labeled CAR T cells at various time points within 46 h p.i. (a) and within 6 h p.i. (b) in NSG, CD19-K562, and Raji mouse models. c AUC(0-inf_obs) for the blood uptake of 89Zr-labeled CAR T cells. d Pearson correlation analysis of the AUC(0-inf_obs) of blood pharmacokinetics vs the blood uptake dose at 4 h p.i. in the NSG, CD19-K562, and Raji models. e Blood uptake of 68Ga-labeled CAR T cells within 4 h p.i. in NSG mice (n = 3). f Pearson correlation analysis of the blood uptake of 68Ga-labeled and 89Zr-labeled CAR T cells. The correlation analysis was based on the blood uptake in NSG mice for both 68Ga-labeled and 89Zr-labeled CAR T cells. Values are expressed as the means ± SD (n = 4). *P < 0.05, **P < 0.01, n.s. P ≥ 0.05 analyzed by one-way ANOVA with Tukey’s post hoc test

