Figure 3.

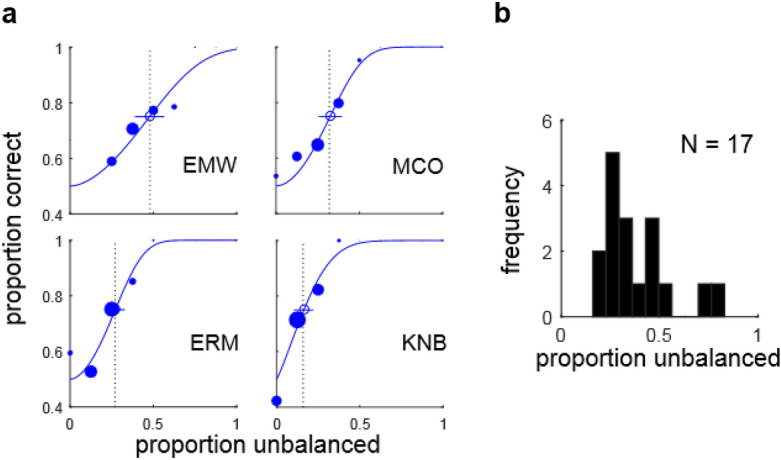
Psychometric functions and threshold distributions. (a) Psychometric functions and fitted functions based on SDT model (blue curves) for four observers (EMW, MCO, ERM, KNB) performing luminance texture boundary (LTB) segmentation (Experiment 1a) as a function of the proportion unbalanced micropatterns (), i.e. the proportion of micropatterns not having a same-polarity counterpart on the opposite side of the boundary. The size of each solid dot is proportional to the number of trials obtained at that level, and dashed black lines denote 75% thresholds for the fitted curves. Circles and lines indicate threshold estimates and 95% confidence intervals obtained from 200 bootstrapped re-samplings of the data. (b) Histogram of segmentation thresholds () measured from all observers (N = 17) in Experiment 1a.
