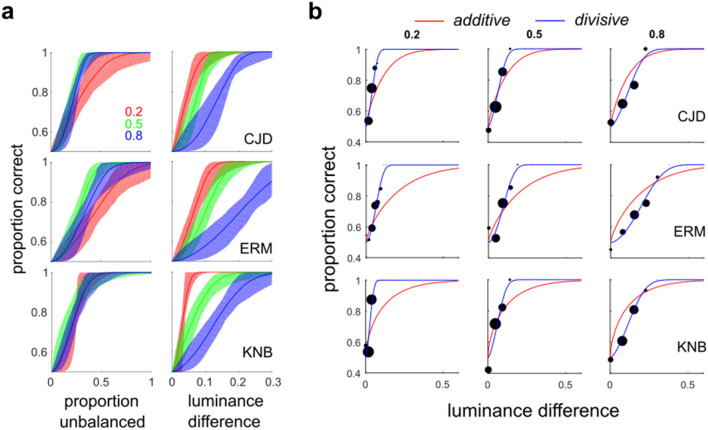
Figure 6.
Using micro-pattern amplitude to vary global luminance difference. (a) Bootstrapped SDT psychometric function fits (200 bootstrapped re-samplings) with 90% confidence intervals of observer performance as a function of proportion unbalanced micropatterns (left panels) and absolute luminance difference (right panels). This shows that identical luminance differences give rise to significantly different levels of observer performance for the three Michaelson contrasts (right panels), i.e. global luminance difference is a very poor predictor of performance. Instead, observer performance is much better predicted by the proportion of unbalanced micro-patterns, (almost) irrespective of micro-pattern amplitude (left panels). (b) Data from Experiment 3 (black dots) and fits of the additive (red) and divisive (blue) image-computable signal detection theory models (IC-SDT) to the data. Each observer was tested at three different maximum micro-pattern amplitudes, which correspond to different Michaelson contrasts (0.2, 0.4, 0.8) of the stimuli. We see that a model incorporating a global luminance difference computation followed by contrast normalization (blue) provides an excellent fit to this data.

