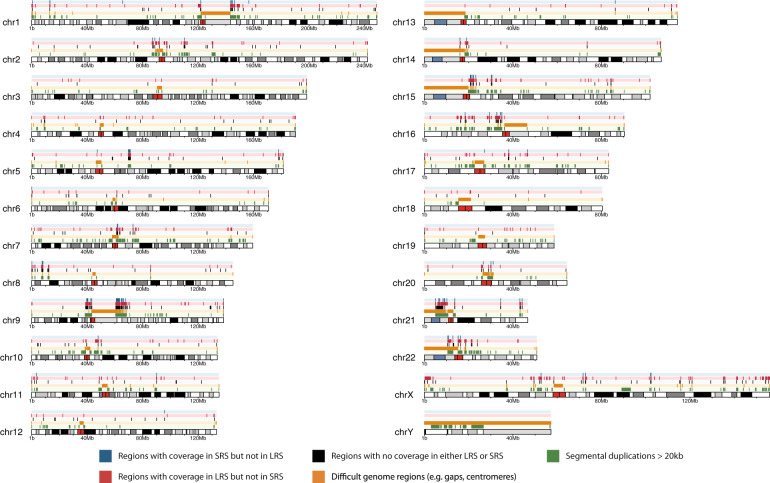
Fig. 2. Schematic digital ideogram depicting genomic regions larger than 1 Kb without LRS or SRS coverage.
From top to bottom tracks indicate: regions with sequence coverage in SRS but no coverage in LRS (blue); regions with sequence coverage in LRS but no coverage in SRS (red); regions with no sequence coverage in neither LRS and SRS (black); genome regions that are difficult to assess like centromeres, telomeres, and gaps (orange); regions with segmental duplications larger than 20 Kb (green). Note that blue, red, black, and orange regions are mutually exclusive but that suggestive overlap from the figure is due to the limited resolution.

