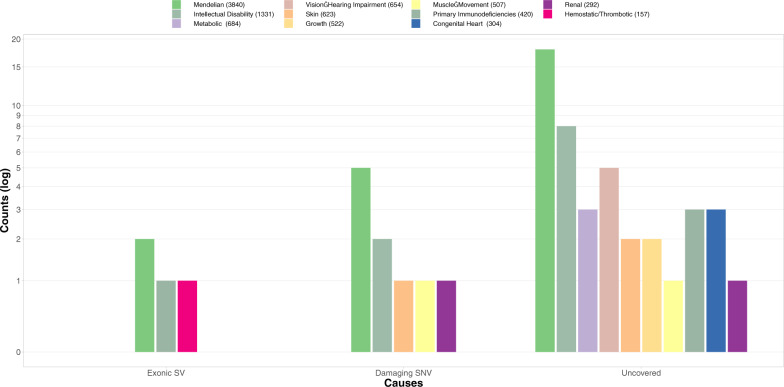
Fig. 3. Interpretation of variation identified by LRS but not SRS.
From left to right showing three groups: the number of genes of which coding regions are affected by an SV, the number genes affected by a putatively damaging SNV identified only in LRS, the number of genes of which coding regions are covered less than 10% in SRS but that do have coverage in LRS. Individual bars indicate different types of disorders based on diagnostic gene panels as used by Genome Diagnostics Nijmegen (https://www.radboudumc.nl/en/patientenzorg/onderzoeken/exome-sequencing-diagnostics/information-for-referrers/exome-panels), genetic testing laboratory. Numbers in the legend indicate the total number of genes in each of the gene panels.

