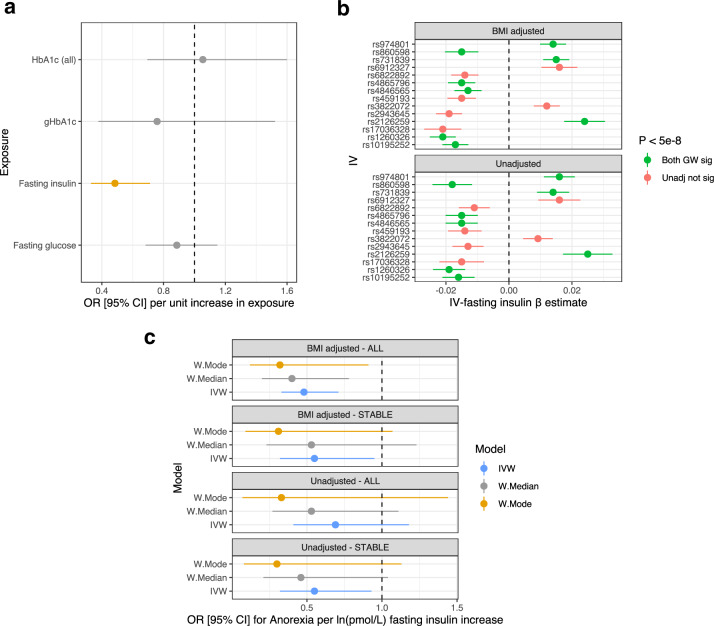
Fig. 1. Effect of glycaemic traits on the risk of anorexia nervosa.
a Forest plot of the IVW estimates of the relationship between glycaemic exposures and anorexia nervosa. The estimates represent an odds ratio (OR) per unit increase in the exposure, with the error bars denoting the 95% confidence interval. The glycaemic exposures were as follows: fasting insulin, fasting glucose. glycated haemoglobin (HbA1c (all)), and a subset of glycaemic glycaeted haemoglobin lead SNPs. There was a significant protective effect of fasting insulin on anorexia nervosa after the application of multiple testing correction, and thus, that estimate is shaded orange. b Comparison of the IV-exposure association effect size for fasting insulin instrumental variables with, and without, phenotypic covariation for body mass index (BMI). The two panels plot the beta estimate of the 14 SNP-fasting insulin associations (error bars are 95% confidence interval) derived from the GWAS with or without adjustment for BMI. IV-estimates highlighted green were associated with fasting insulin at genome-wide significance (P < 5 × 10⁻⁸) irrespective of BMI adjustment (“both GW sig”), whilst red shaded SNP-exposure effects were only significant upon covariation for BMI. c Sensitivity analyses of BMI adjusted and unadjusted fasting insulin instrumental variables. We defined the instrumental variables for fasting insulin as follows: all IVs unadjusted for BMI, all IVs adjusted for BMI, IVs significant irrespective of BMI (stable IVs – estimates with and without BMI adjustment used). The forest plot denotes three MR estimators (IVW, weighted median, and weighted mode) using each of these IV subsets; each point represents the odds ratio for anorexia nervosa per natural log transformed pmol/L fasting insulin.

