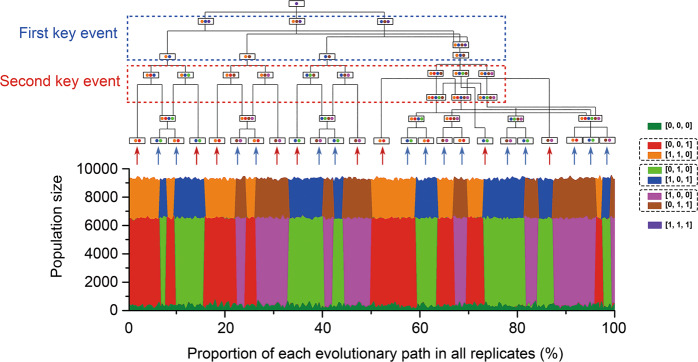
Fig. 3. The evolutionary trajectories of 296 independent simulations with the typical parameter set (mut = 10−5, α = 0.001, β = 0.8).
We analyzed the evolutionary trajectories of every interdependent run and clustered them into 24 types of branches (top, see Methods). The area plot shows the final community structures and the frequencies of each branch (bottom). Blue dashed box shows the evolutionary diversification into four scenarios after the first key event occurs, while the red dashed box indicates the 24 different evolutionary trajectories that diverged after the second key event occurs. Solid boxes with colored circles represent the genotypic composition of communities at different evolutionary time points. Red arrows indicate the branches where one type of asymmetric functional complementary pair (AFCP) directly dominated the communities without competition with other AFCPs, while the blue arrows indicate the branches where one type of AFCP took over the entire space after competitions with other AFCPs. Dashed boxes at the figure labels (right) indicate different AFCPs.

