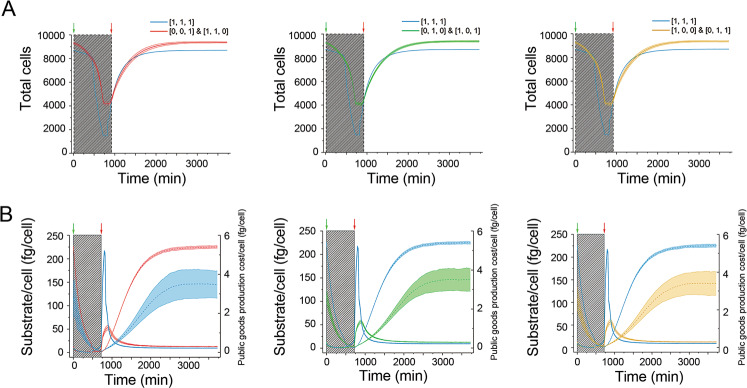
Fig. 6. Community dynamics during the nutrient disturbances.
Final communities (after 1,700,000 time-step iterations) composed of pair [0, 0, 1] & [1, 1, 0], pair [0, 1, 0] & [1, 0, 1], or pair [1, 0, 0] & [0, 1, 1] were selected to be treated with nutrient disturbances, respectively. As the control, the communities from the same simulations but only after 500 time-step iterations (still dominated by [1, 1, 1]), were taken out to perform same treatments. We stopped the substrate supply for 12 h, then rerestarted the supply. Dynamics of each population are shown in (A), where each curve shows the average results of five repeated runs starting with ten representative communities selected from the 296 interdependent simulations mentioned before. The average available substrate for a cell (solid line) and the cost of public goods production (dashed line) at each step during simulations are shown in (B). Running parameters: mutation rate = 0, α = 0.001, and β = 0.8.

