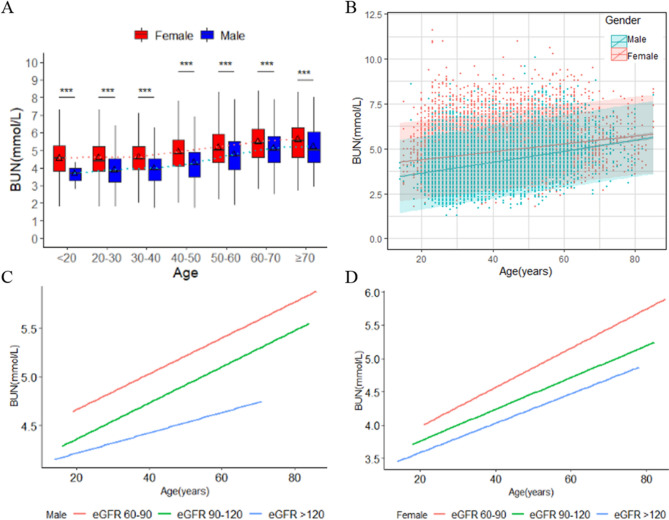
Figure 2.
Sex-specific association between age and blood urea nitrogen (BUN). (A) Sex-specific boxes plots of BUN by age groups in males and females population. The black triangle in the box plots indicates the mean value. The dotted light red line represents the mean value line for each males age groups. The dotted light green line represents the mean value line for each females age groups. The definition of red boxes represent males population and blue boxes represent females population, ***P < 0.001. (B) Scatter plot of association between age and BUN by sex in males and females population. Solid lines express predicted BUN by age and sex with 95% prediction intervals (shaded area) for each sex. (C,D) Sex-specific associations between BUN levels and age by groups of estimated glomerular filtration rate (eGFR) in the males and females population assessed by linear regression.

