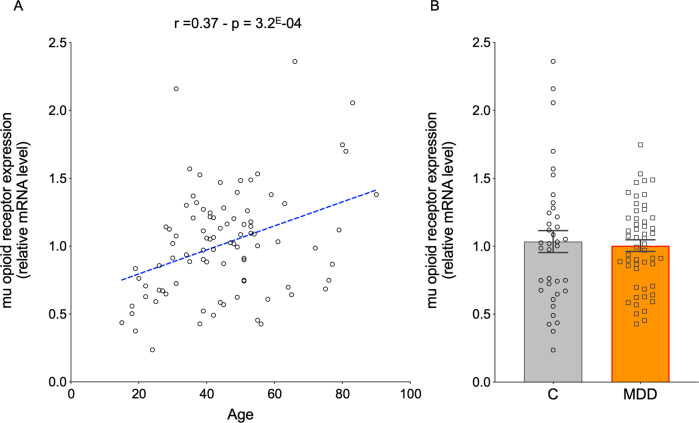
Fig. 1. Relative real-time quantitative PCR (RT-PCR) expression of the mu opioid receptor (MOR) in the anterior insula by age and clinical group.
A. MOR expression was quantified by RT-PCR in quintuplicates, using calibration curves and two reference housekeeping genes: GAPDH and β-actin (see methods for details). The scatter plot displays a significant positive linear correlation between MOR expression and age, in all subjects, independent of clinical group (r = 0.37, p = 3E−04). B Expression of MOR in healthy controls and subjects who died during a major depressive episode (MDD). There was no significant difference between the two clinical groups (F(1,86) = 1.11, p = 0.27). Mean ± sem, as well as individual expression values, are shown.

