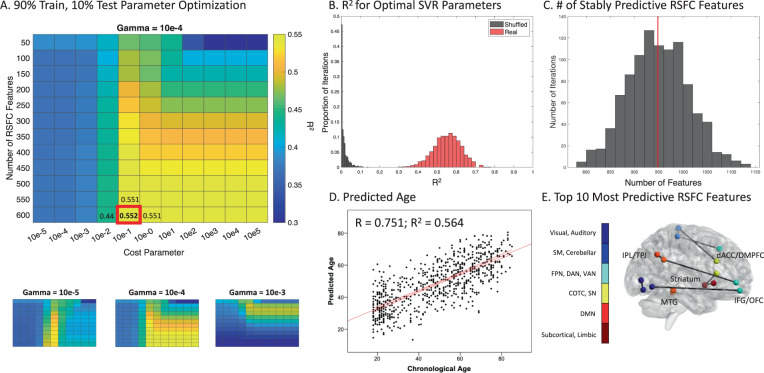
Fig. 2. Tuning and training a support vector regression model predicting brain age based on rsFC in HC.
A Grid search for optimizing SVR model parameters. Heatmaps of R2 representing the relationship between the chronological and predicted age in held-out data as a function of gamma and cost parameters, and number of rsFC features. The best combination of parameters is enlarged and presented in the red box (mean R2 = 0.552 ± 0.071). B Histogram visualizing the R2 across all 1000 training iterations for the best combination of parameters in real (red) and shuffled (gray) data. Real data R2 95% confidence interval [CI]: 0.403 0.682, range: 0.312–0.764; shuffled data R2 CI: 0.000–0.071, range: 1.129e − 9 to 0.136. C Histogram representing the number of rsFC features stably predictive of age across all 1000 training iterations. The vertical red line indicates the mean. D Scatterplot representing the correlation between chronological and predicted age in HC. The red lines indicate the regression line and the 95% confidence interval. E The top 10 most predictive rsFC features ranked by support vector regression weights. These features consisted of rsFC between: dorsal anterior cingulate cortex/DMPFC and motor regions; bilateral dorsal and ventral striatum; striatum and right inferior frontal gyrus; right IFG and orbitofrontal cortex; right parietal and visual regions; and between the bilateral medial temporal gyrus. dACC: dorsal anterior cingulate cortex, DMPFC: dorsomedial prefrontal cortex, IFG: inferior frontal gyrus, IPL: inferior parietal lobule, MTG: medial temporal gyrus, OFC: orbitofrontal cortex, TPJ: temporoparietal junction.

