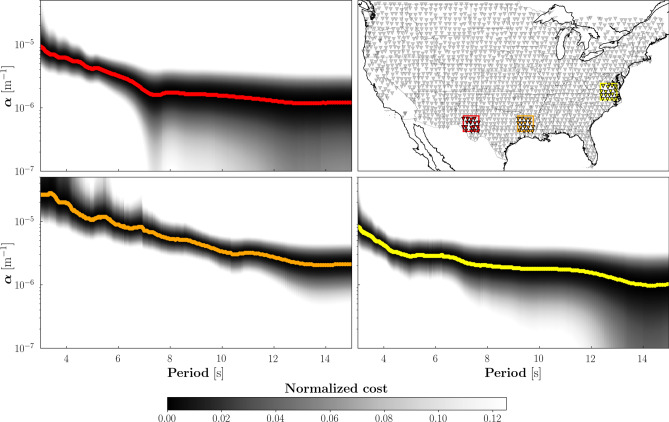
Figure 1.
Map of the study area with three different blocks highlighted in red, orange, and yellow (upper right). The corresponding sub-arrays consist of 18, 16, and 18 receivers (colored triangles), respectively. All other seismic stations employed in these study are shown as gray triangles. The remaining subplots show the normalized cost (i.e., data misfit) as a function of period and , evaluated independently for each sub-array via grid search15. The three cost functions are characterized by well defined minima at each period (identified by the same colors previously associated to the blocks), which represent the final attenuation curves.

