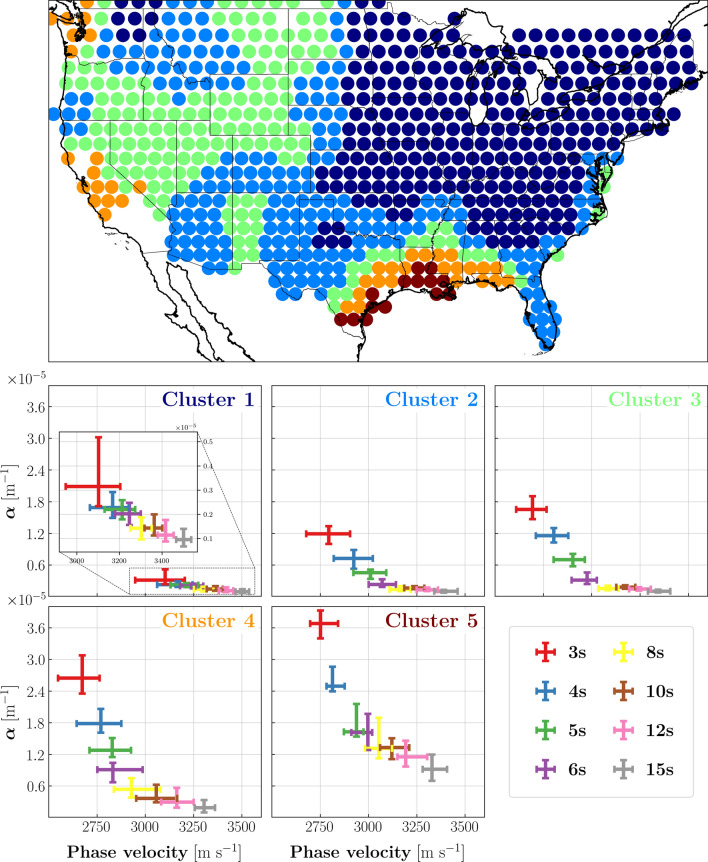
Figure 5.
Results of cluster analysis, where each color identifies a different class. (Top) Spatial distribution of the five classes throughout the study area. (Bottom) Rayleigh-wave attenuation coefficient as a function of phase velocity. For each of the five clusters, 20th and 80th percentiles of and c are shown in the form of error bars at different periods. At a given period, indicated by the color, the two bars intersect at the median value of and c. Note the kink visible between 5 and 8 s in all sub-panels except for that relative to Cluster 1, corresponding with the eastern, cratonic North America. Because attenuation in that area is low, the values of Cluster 1 are zoomed to improve the visibility of vs c.

