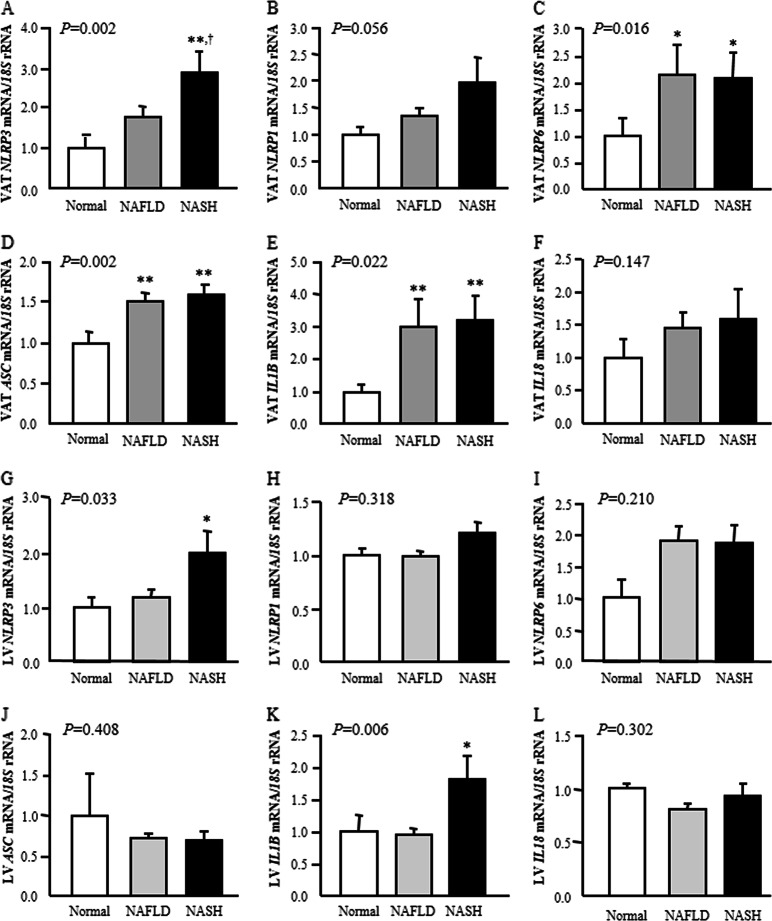
Fig. 2.
Effect of nonalcoholic fatty liver disease (NAFLD) and nonalcoholic steatohepatitis (NASH) on visceral adipose tissue and hepatic gene expression levels of the main inflammasome components. Bar graphs show the mRNA levels of a, g NLRP3, b, h NLRP1, c, i NLRP6, d, j ASC, e, k IL1B and f, l IL18 in visceral adipose tissue and liver according to hepatic function. Bars represent the mean ± SEM. Differences between groups were analyzed by one-way ANOVA followed by Tukey’s tests. *P < 0.05 and **P < 0.01 vs. normal liver. †P < 0.05 vs. NAFLD

