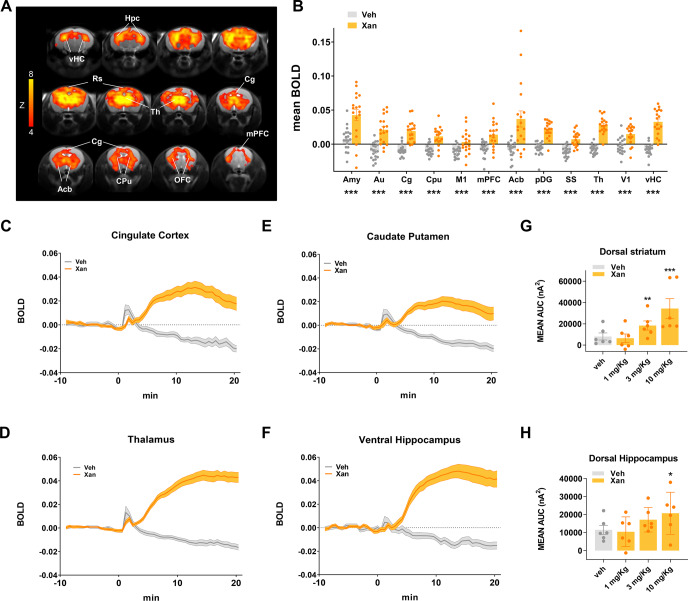
Fig. 1. Xanomeline increases functional brain activity as measured with BOLD fMRI and O2 amperometry in the mouse.
A Maps of BOLD fMRI response elicited by a xanomeline challenge (30 mg/kg s.c.) with respect to the vehicle-treated control group. Orange/yellow indicate increases in BOLD signal (Z > 4, p < 0.05, cluster corrected). B BOLD response to xanomeline in representative ROIs. The effect was plotted as mean BOLD ± SEM. (t-test, *p < 0.05, **p < 0.01, ***p < 0.001, FDR corrected). Time course of BOLD signal in cingulate cortex (C), thalamus (D) caudate putamen (E), and ventral hippocampus (F), respectively. Xanomeline was injected at time 0. Vehicle n = 19, xanomeline n = 18. O2 amperometry changes showing dose-dependent increases measured by probes positioned in the dorsal striatum (G) and dorsal hippocampus (H). Effects are plotted as mean amperometric current ± SEM. (Fishers LSD, *p < 0.05, **p < 0.01, ***p < 0.001, versus vehicle group). Amy amygdala, Au auditory cortex, Cg cingulate cortex, Cpu caudate putamen, M1 primary motor cortex, mPFC medial prefrontal cortex, Acb accumbens, pDG posterior dentate gyrus, SS somatosensory cortex, Th thalamus, V1 primary visual cortex, vHC ventral hippocampus, VTA ventral tegmental area, Hpc hippocampus, Rs retrosplenial cortex, OFC orbitofrontal cortex.

