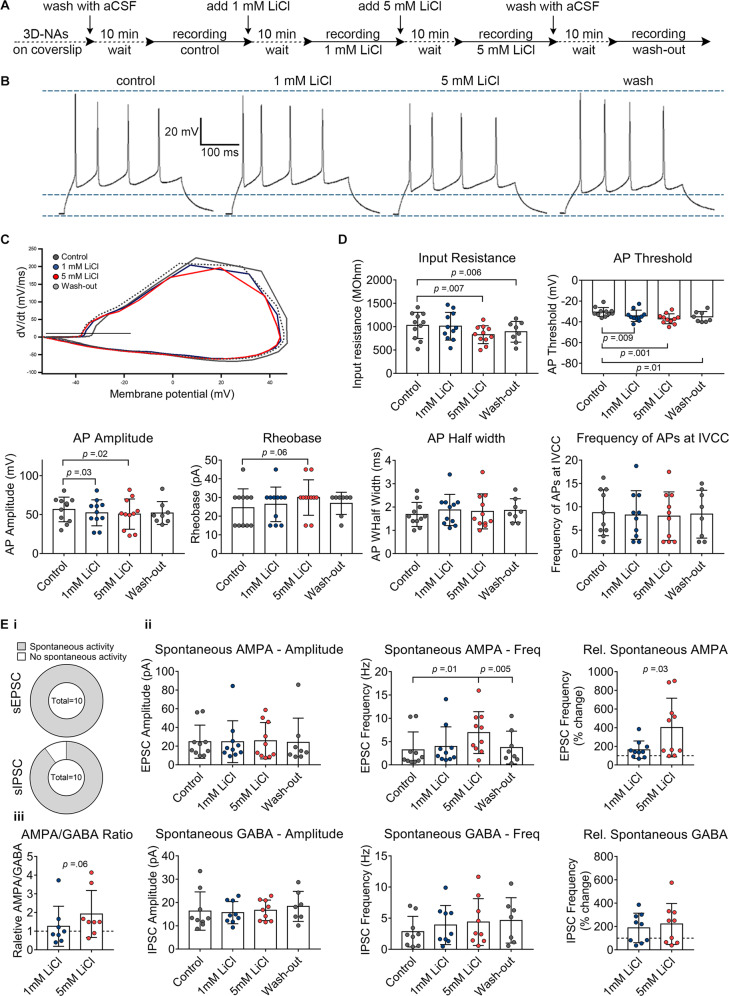
Fig. 3. Patch–clamp recordings reveal the concentration-dependent impact of lithium chloride (LiCl) on excitability and synaptic function of human cortical neurons.
A Schematic representation of the applied protocol to evaluate the effect of therapeutic and overdose concentrations of LiCl on the hiPSC-derived neurons. B Examples of evoked firing responses to a 300 ms current injection of 45 pA into a current-clamped neuron at baseline, exposed to 1 mM, 5 mM LiCl, and after wash-out. C Examples of phase plane plots, calculated as the first derivative of the membrane potential at the initial AP, in a train of at least two APs, against the membrane potential. The black line denotes the AP threshold (at 10 mV/ms). D Diagrams illustrate the membrane potential parameters in the different conditions with individual cells shown as scattered dots. n = 11 (n = 8 for wash-out), N = 3. E, i Pie charts show the percentage of cells with spontaneous EPSCs and spontaneous IPSCs. A total number of cells is given in the center. E, ii Average frequency and amplitude of spontaneous EPSCs and IPSCs in the different conditions with individual cells shown as scattered dots. The relative frequency of the spontaneous events compared to baseline is also shown. E, iii The ratio of the average frequency of spontaneous AMPA/GABA, n = 10, N = 3. The experiments were done in a paired setup. The data are presented as mean ± standard deviation. One-way ANOVA with Dunnett’s correction (baseline compared to the indicated group) was applied to calculate the shown p values. For comparing the “wash-out” group, a paired t test was used for p value calculation. In the diagrams showing relative values, the p values were calculated by unpaired t test.

