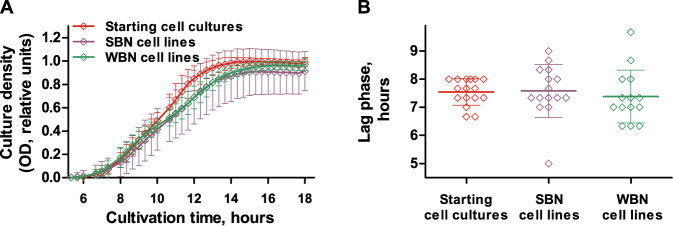
Fig. 3. Growth characteristics of the evolved S. enterica clones.
The growth of six S. enterica starting cultures, six SBN cell lines, and the average growth of 30 clones from overall five WBN cell lines was recorded in LB medium + 0.2% glucose (three independent experiments, technical triplicates) (A). The lag phase of S. enterica was calculated from their growth curves using linear regression (B). Graph A shows average values and standard deviation and graph B shows individual values, average values, and standard deviation. No statistically significant differences between lag phases were identified as calculated using the Mann–Whitney test.

