Figure 2.

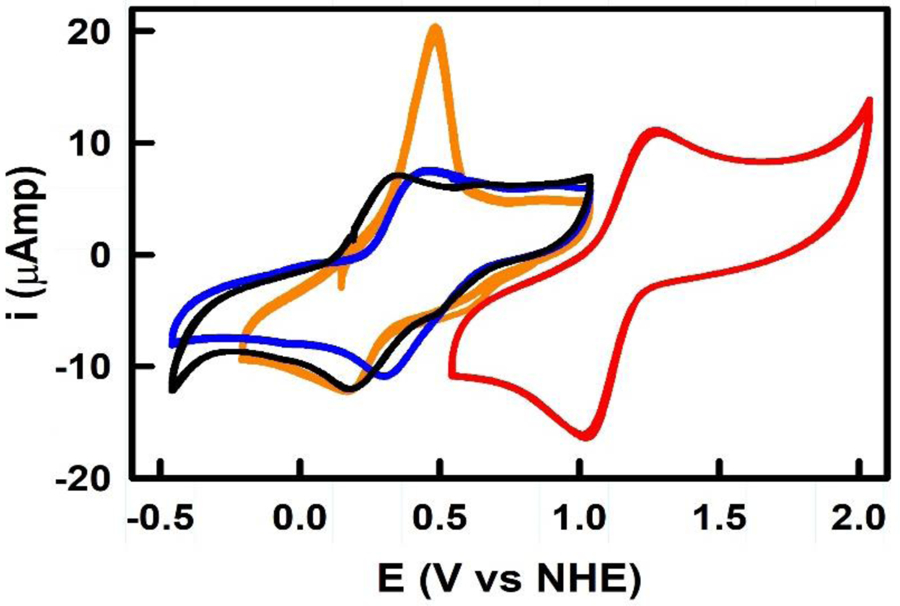
Cyclic voltammograms of complexes 1–4 vs NHE showing the Cu2+/+ redox couple at concentrations of 1 mM with a scan rate of 100 mV/s. 1, 2, 3, and 4 are shown in black, blue, orange, and red, respectively.

Cyclic voltammograms of complexes 1–4 vs NHE showing the Cu2+/+ redox couple at concentrations of 1 mM with a scan rate of 100 mV/s. 1, 2, 3, and 4 are shown in black, blue, orange, and red, respectively.