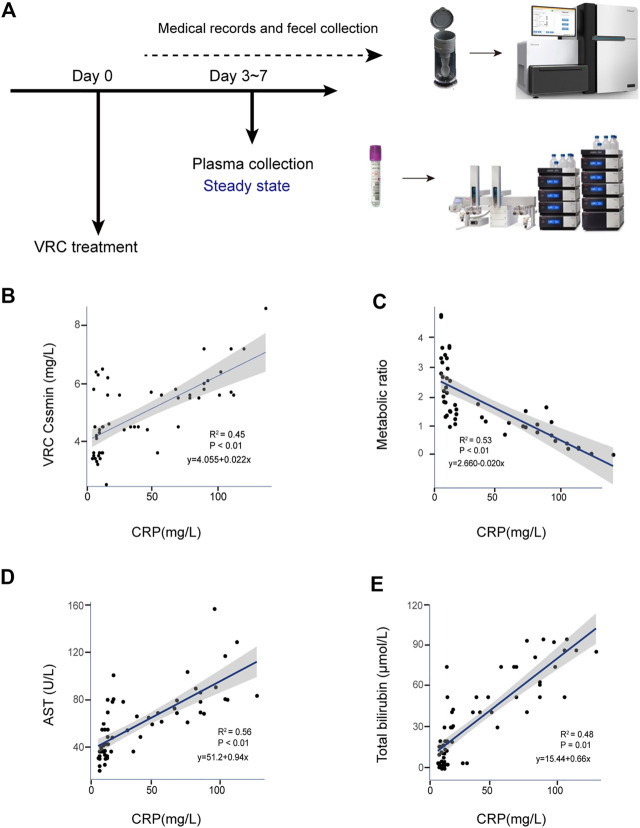
FIGURE 1.
Correlation between CRP and adverse reactions in clinical voriconazole administration. (A) Schematic of sample collection process. (B) Scatterplot of VRC Cssmin vs. CRP concentration (mg/L). (C) Scatterplot of VRC metabolic ability vs. CRP concentration (mg/L). (D,E) Correlation between the CRP and liver function parameters possibly induced by voriconazole in peripheral blood. Each graph presents a trend line, regression equations, R-squared values (R2) and p-values of the regression model are shown on the figures (n = 65).

