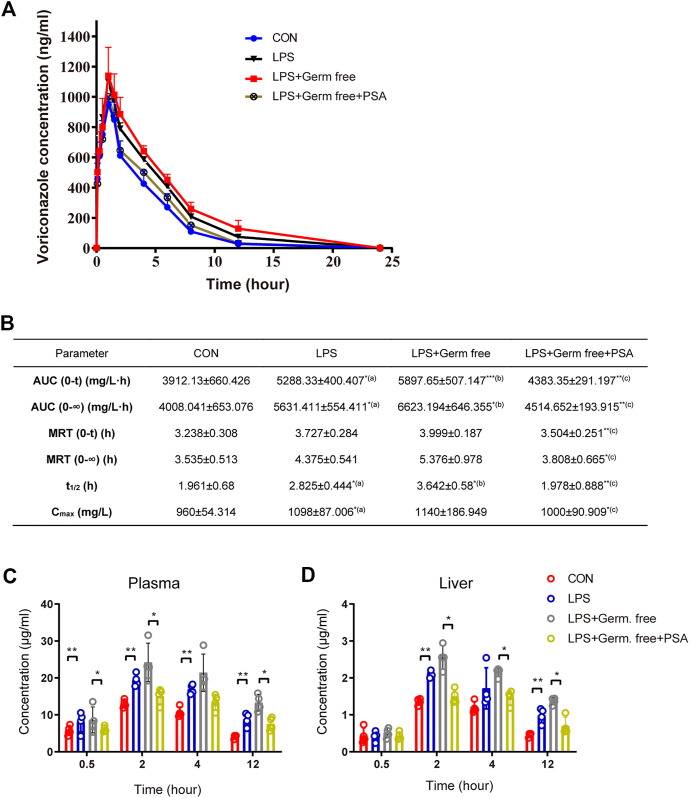
FIGURE 4.
VRC metabolism by LPS with or without PSA treated rats and mice. (A) VRC plasma kinetics in individual rats (n = 5, respectively). (B) Pharmacokinetic (PK) parameters in rats. (C) VRC blood concentrations in individual mice (n = 5, respectively). (D) VRC liver tissue concentrations in individual mice. The PK parameters were calculated according to the noncompartmental PK calculated by DAS 2.0 software. Tmax, maximum time corresponding to Cmax; AUC (0-∞), area under the curve from 0 to ∞; MRT, Mean residence time; t1/2, half-life; Cmax, maximum concentration; Rats receiving a single dose of VRC, 10 mg/kg; Mice receiving a single dose of VRC, 10 mg/kg. (a) LPS vs. CON; (b) LPS + Germ free vs. LPS; (c) LPS + Germ free + PSA vs. LPS + Germ free. Unpaired t test, *p < 0.05, **p < 0.01, ***p < 0.001.

