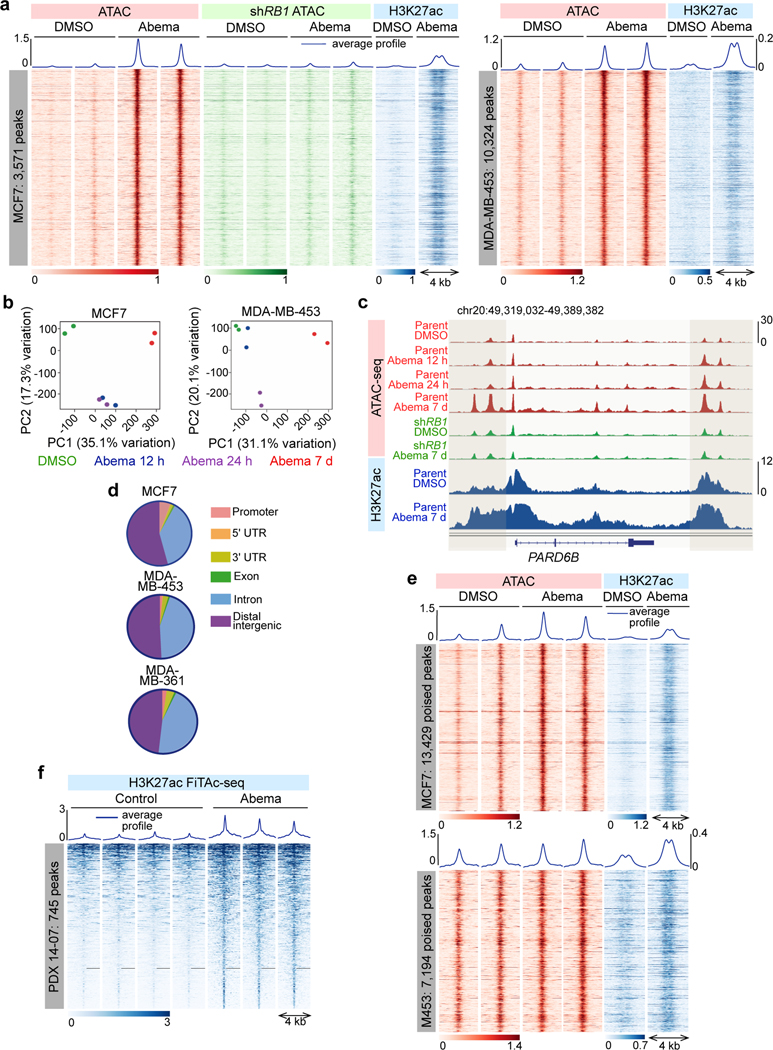
Fig. 1 |. CDK4/6 inhibition induces chromatin remodeling in breast cancer.
a, ATAC- and ChIP-seq heatmaps for regions with significantly increased ATAC-seq peak signal (up peaks) after 7 days of abemaciclib treatment in MCF7 (left) and MDA-MB-453 (right), determined by a threshold of adjusted P<0.05 calculated by DESeq2. Abemaciclib concentration used in vitro was 500 nM for all experiments unless otherwise noted. ATAC in red (parental cells) and green (cells expressing shRNA against RB1; shRB1); H3K27ac signals in the same genomic regions in parental cells are shown in blue.
b, Principal component analysis of ATAC-seq peaks in cells after treatment with DMSO or abemaciclib for the indicated times.
c, ATAC-seq and H3K27ac ChIP-seq tracks at the PARD6B locus in MCF7 parental and MCF7 shRB1 cells treated with DMSO or abemaciclib for 12 hours, 24 hours, or 7 days. Grey shading highlights regions where treatment-induced increases in ATAC-seq signal are seen in parental but not shRB1 cells.
d, Genomic distribution of regions showing significantly increased ATAC-seq signal from a and Extended Data Fig. 1g.
e, ATAC-seq and H3K27ac ChIP-seq heatmaps for regions with new H3K27ac peaks but no significant increase in ATAC-seq signal (“poised” enhancers) after abemaciclib treatment.
f, Heatmap depicting regions gaining H3K27ac (FiTAc-seq) in PDX 14–07 tumors treated with control or abemaciclib.

