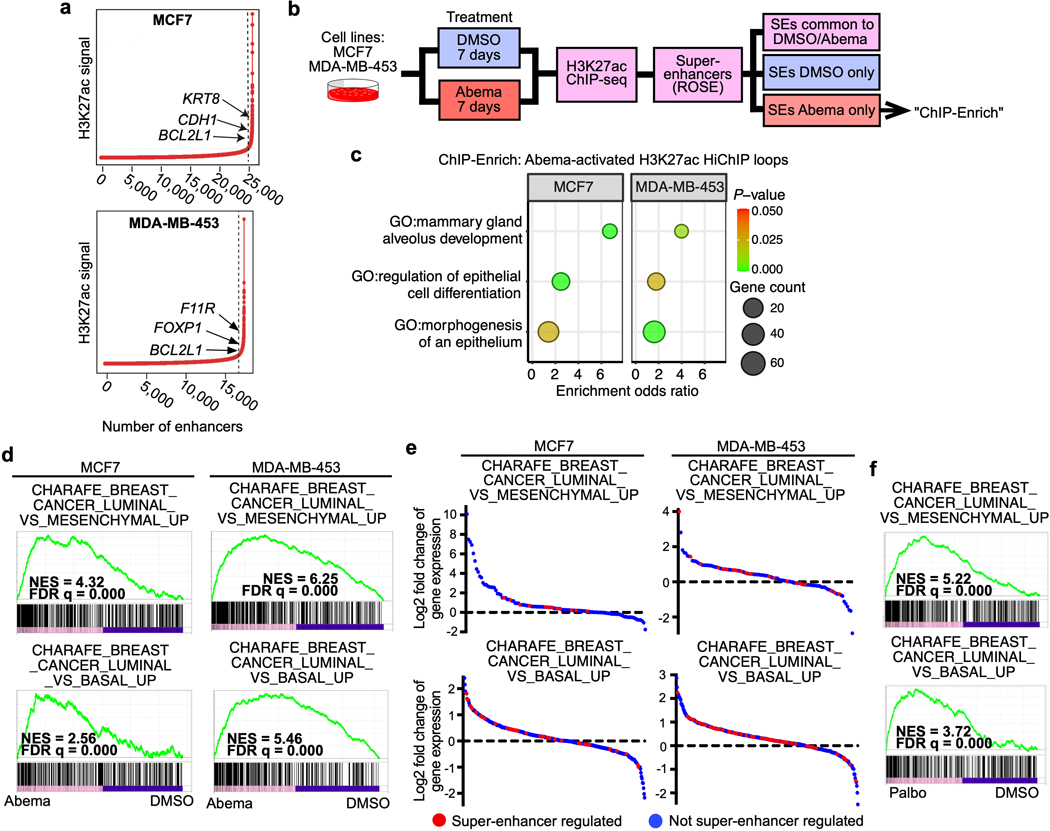
Extended Data Fig. 2. Characterization of CDK4/6 inhibitor-activated super-enhancers in breast cancer cell lines.
a, Signal distribution at abemaciclib-activated H3K27ac-marked enhancers in MCF7 and MDA-MB-453 cells. Arrows indicate the positioning of super-enhancers (to the right of dashed line).
b, Schema for analysis of biological processes regulated by abemaciclib-activated super-enhancers.
c, GO analysis of non-TSS ends of H3K27ac-decorated genomic loops (HiChIP) identified exclusively in abemaciclib-treated MCF7 and MDA-MB-453 cells. Odds ratios and P-values were calculated by ChIP-Enrich.
d, Gene Set Enrichment Analysis (GSEA) of RNA-seq data from MCF7 and MDA-MB-453 cells treated with abemaciclib compared to DMSO.
e, RNA-seq log2 fold change of gene expression of all genes within indicated GSEA gene sets in MCF7 and MDA-MB-453 cells treated with DMSO or abemaciclib for 7 days, calculated by DESeq2. Each dot represents one gene: red, predicted to be regulated by abemaciclib-activated super-enhancers; blue, not predicted to be regulated by abemaciclib-activated super-enhancers.
f, GSEA of RNA-seq data from MCF7 and MDA-MB-453 cells treated with palbociclib compared to DMSO. FDR q values in d and f were calculated by GSEAPreranked.

