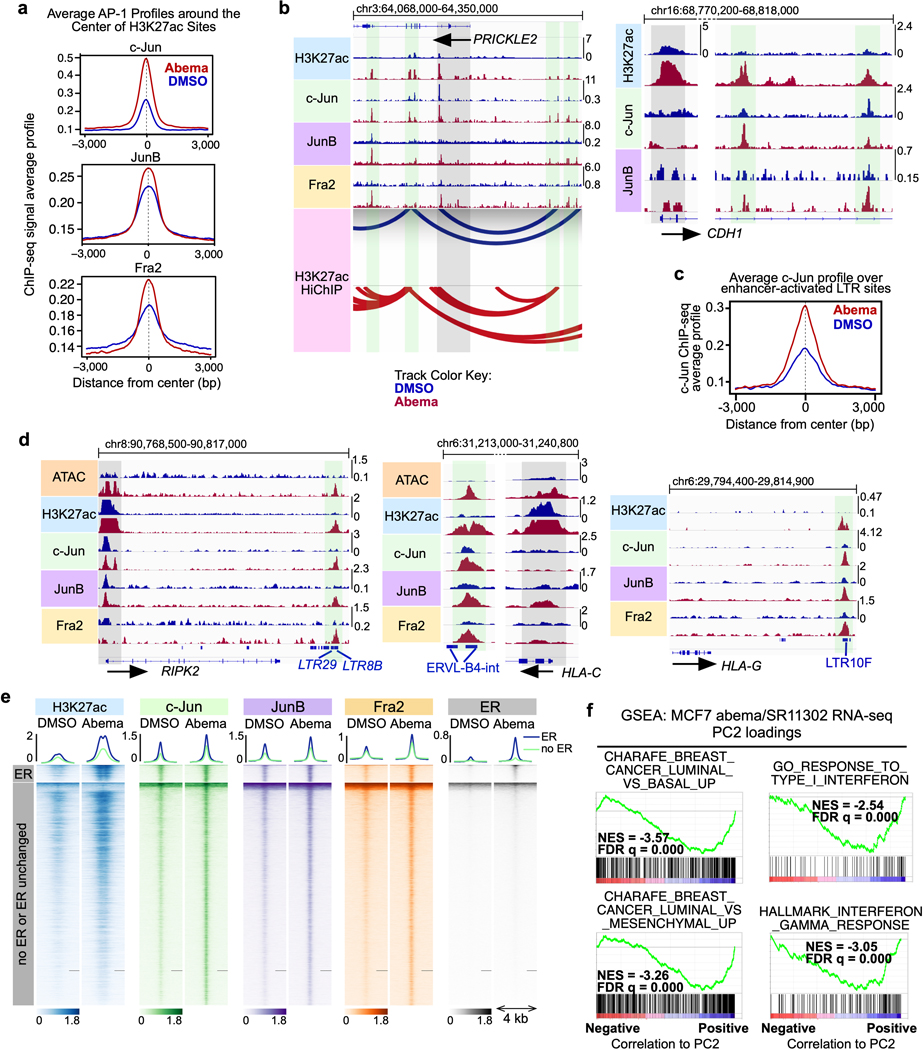
Extended Data Fig. 8. AP-1 binding increases at CDK4/6i-induced enhancers and drives transcriptional activity that can be reversed by an AP-1 inhibitor.
a, Composite profile of c-Jun, JunB, and Fra2 ChIP-seq signals in MCF7 cells treated with DMSO or abemaciclib over regions of abemaciclib-induced H3K27ac up-peaks.
b, H3K27ac, c-Jun, JunB, and Fra2 ChIP-seq tracks at PRICKLE2 and CDH1 loci in MCF7 cells treated with DMSO or abemaciclib. DNA loops (called by FDR<0.01) from H3K27ac HiChIP are depicted for PRICKLE2. Grey highlights indicate gene promoters. Green highlights indicate regions with abemaciclib-induced increases in both H3K27ac signal and c-Jun binding.
c, Composite profile of c-Jun ChIP-seq signal over abemaciclib-activated LTR enhancers in MCF7 cells treated with DMSO or abemaciclib.
d, H3K27ac, c-Jun, JunB, and Fra2 ChIP-seq tracks at RIPK2, HLA-C, and HLA-G loci in MCF7 cells treated with DMSO or abemaciclib. Green highlights as in b. LTRs annotated with Repeat Masker are shown in blue.
e, Heatmap of H3K27ac, c-Jun, JunB, Fra2, and estrogen receptor (ER) ChIP-seq profiles at regions showing increased binding for any of c-Jun, JunB, or Fra2 (combined) after 7 days of abemaciclib treatment in MCF7 cells. The cluster “ER” denotes regions with increased ER binding after abemaciclib treatment and contains 1,124 regions. The cluster “no ER or ER unchanged” denotes regions with no change in ER binding or no ER at all and contains 14,504 regions.
f, Analysis of GSEA signatures associated with luminal differentiation and interferon response using Principle Component 2 loadings from Fig. 7c. NES and FDR q values were calculated using GSEAPreranked.

