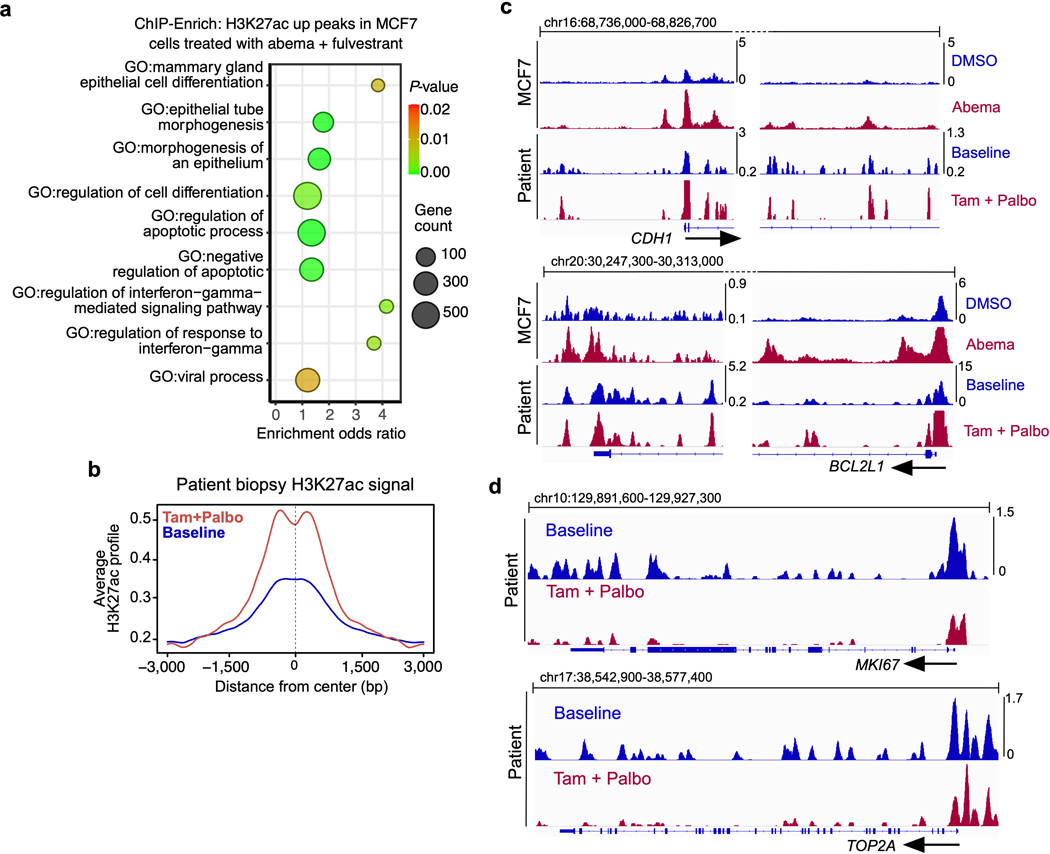
Extended Data Fig. 9. Patterns of enhancer activation in breast cancers treated with combined CDK4/6 inhibition and endocrine therapy.
a, ChIP-Enrich analysis of regions gaining H3K27ac in MCF7 cells treated with abemaciclib plus fulvestrant (100 nM) versus DMSO for 7 days.
b, Composite profiles of H3K27ac ChIP-seq signal from patient biopsies (baseline and tamoxifen + palbociclib, as in Fig. 8a), centered over ATAC peak-intersected, abemaciclib-induced H3K27ac up-peaks in MCF7 cells.
c, H3K27ac ChIP-seq tracks at CDH1 and BCL2L1 from MCF7 cells and tumor biopsies from same patient as in b.
d, H3K27ac ChIP-seq tracks at MKI67 and TOP2A from tumor biopsies from same patient as in b.

