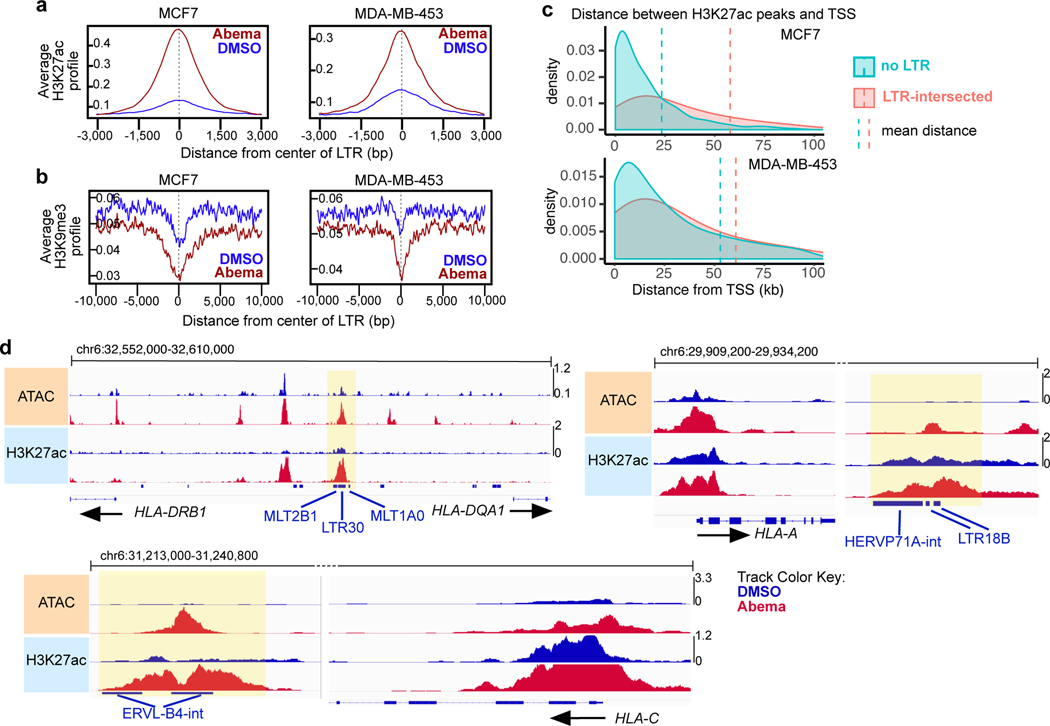
Fig. 5 |. CDK4/6 inhibitor-activated LTR enhancers are predicted to regulate immune genes.
a,b, Composite profiles of H3K27ac (a) and H3K9me3 (b) ChIP-seq signals at abemaciclib-activated LTR enhancers in MCF7 and MDA-MB-453 cells after 7 days of treatment. Zero on x-axes represents center of each LTR region.
c, Density plots of distances between abemaciclib-induced H3K27ac up-peaks and the nearest transcriptional start site (TSS) in MCF7 and MDA-MB-453 cells (red: LTR-intersected enhancers; blue: non-intersected with LTRs). Vertical dashed lines indicate mean distances.
d, Representative ATAC-seq and H3K27ac ChIP-seq tracks at abemaciclib-activated LTR enhancers and adjacent immune genes in MCF7 treated with DMSO or abemaciclib for 7 days. LTRs annotated using Repeat Masker are shown as blue bars. Yellow highlights indicate H3K27ac up-peaks that align with an LTR.

