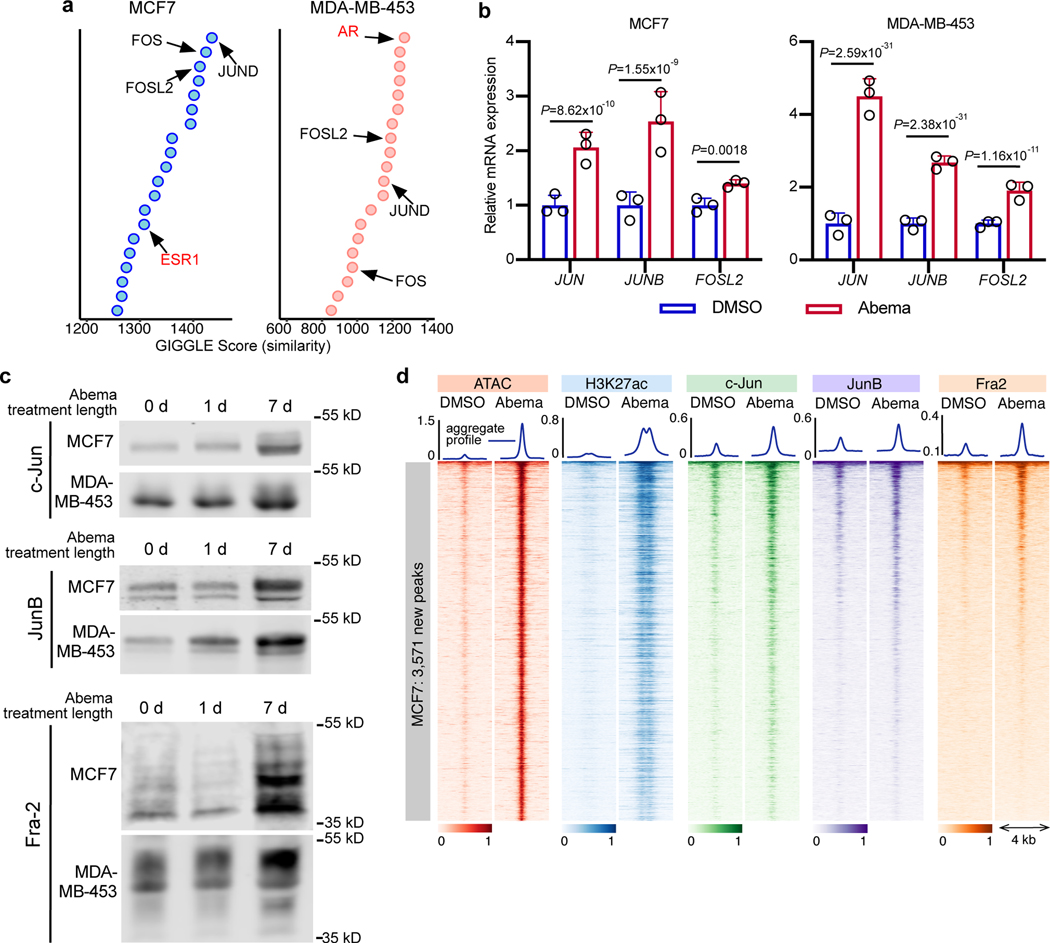
Fig. 6 |. CDK4/6 inhibitor-induced active enhancers demonstrate increased AP-1 binding.
a, Similarity (GIGGLE) scores between regions of increased H3K27ac signal genome-wide in MCF7 and MDA-MB-453 cells after abemaciclib treatment, and GEO-archived datasets of ChIP-seq for transcription factors (using “Cistrome Toolkit”). Top 20 factors identified are shown - AP-1 factors (black) and steroid hormone receptors (red) are labeled.
b, Relative RNA-seq normalized reads of AP-1 factors in MCF7 and MDA-MB-453 treated with DMSO or abemaciclib for 7 days (n=3 independent cultures). Means ± s.d. are shown. DESeq2 was used to calculate adjusted P-values.
c, Western blot showing AP-1 factor protein expression in nuclear extracts of MCF7 and MDA-MB-453 cells treated with abemaciclib for 0, 1, or 7 days (equal number of nuclei per lane). Images of c-Jun and JunB are representative of three independent experiments in MCF7, image of Fra2 is representative of two independent experiments. Image of JunB in MDA-MB-453 is representative of two independent experiments, and images of c-Jun and Fra2 are representative of one experiment. Western blots are cropped; uncropped blot images for the experiments in this figure are shown in Source Data Fig. 6.
d, Heatmap of c-Jun, JunB, and Fra2 binding (ChIP-seq) at abemaciclib-induced ATAC up-peak regions as in Fig. 1a in MCF7 cells treated with DMSO or abemaciclib.

