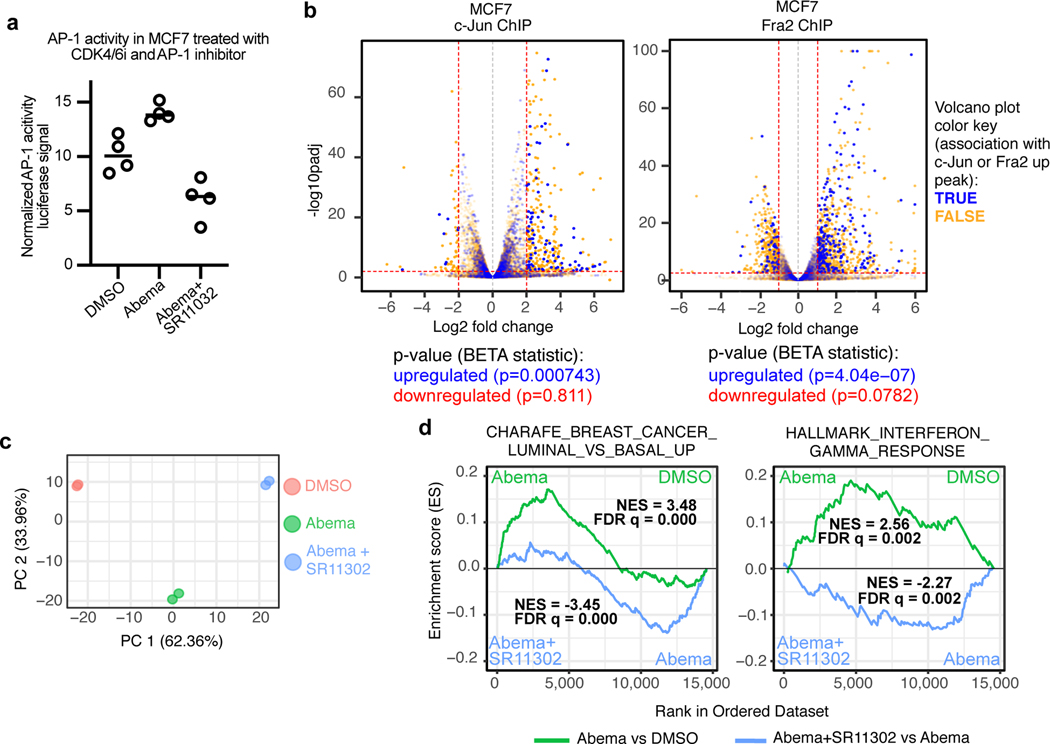
Fig. 7 |. Upregulation of key transcriptional signatures by CDK4/6 inhibitors is mitigated by concomitant inhibition of AP-1.
a, Relative AP-1 transcriptional activity (firefly:renilla luciferase ratio) in MCF7 cells transfected with the AP-1 firefly luciferase reporter plasmid and a Renilla luciferase plasmid. Cells were treated with DMSO, abemaciclib, or abemaciclib plus SR11302 for 7 days (n=4 technical replicates from one experiment).
b, Association between abemaciclib-induced c-Jun (left) or Fra2 (right) up-peaks and gene expression in MCF7 cells treated with DMSO or abemaciclib. Volcano plots depict RNA-seq log2 fold change and adjusted P-values were calculated by DESeq2. Each dot represents one gene: blue indicates association with AP-1 factor up-peak, and orange indicates no association, as reported by BETA. P-values below plots denote the significance of associations relative to background as calculated by BETA.
c, Principal components analysis of RNA-seq data from MCF7 cells treated with DMSO, abemaciclib, or abemaciclib and SR11302 (n=2 technical replicates from one experiment).
d, Gene set enrichment analysis (GSEA) plots of RNA-seq of MCF7 cells treated with abemaciclib compared to treatment with DMSO or the combination of abemaciclib and SR11302. Normalized enrichment scores (NES) and false discovery rate (FDR) q values were calculated using GSEAPreranked.

