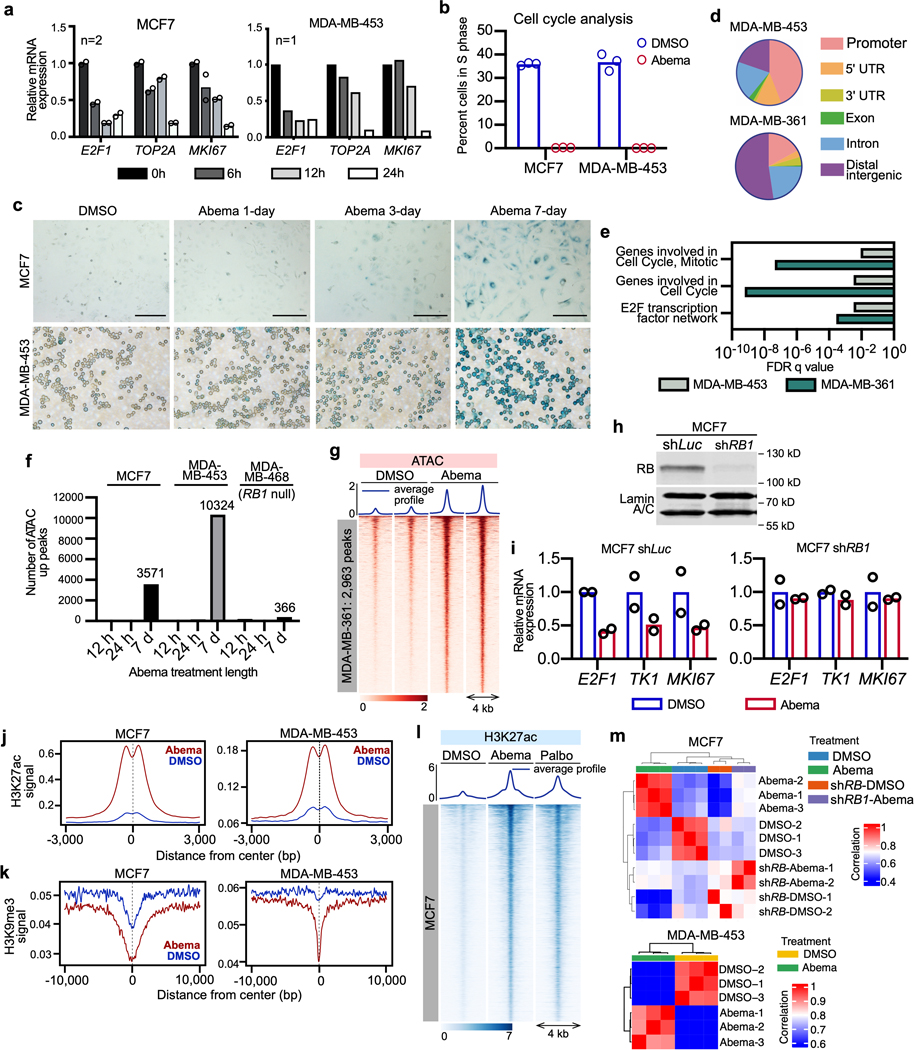
Extended Data Fig. 1. Transcriptional, phenotypic, and epigenetic effects of CDK4/6 inhibitors in human breast cancer cells.
a, Relative RNA-seq normalized reads of representative E2F target genes in breast cancer cell lines treated with abemaciclib for the indicated times (n=2 in MCF7, n=1 in MDA-MB-453, independent cultures).
b, Percentage of cells in S-phase in cell lines treated with dimethyl sulfoxide (DMSO; control) or abemaciclib (abema) for 24 hours (n=3 independent cultures).
c, Representative senescence-associated β-galactosidase staining (blue) of cells treated with DMSO or abemaciclib for 1, 3, or 7 days. Scale bars represent 200 μm. Representative images of two independent experiments in MCF7 and two technical replicates from one experiment in MDA-MB-453.
d, Genomic distribution of regions of significantly reduced ATAC-seq signal in cells treated with abemaciclib, compared to DMSO.
e, GREAT (Genomic Regions Enrichment of Annotations) analysis of regions of significantly reduced ATAC-seq signal within 10 kb of the single nearest gene in cells treated with abemaciclib for 7 days (compared to DMSO).
f, Number of regions with significantly increased ATAC-seq signal in cells treated with abemaciclib as indicated.
g, Heatmap of regions with significantly increased ATAC-seq peak signal after abemaciclib treatment in MDA-MB-361. Up-peaks were determined by a threshold of adjusted P<0.05 calculated by DESeq2.
h, Western blot for RB in MCF7 shLuc and shRB1 cells, representative images from two independent experiments. Western blots are cropped; uncropped blot images for the experiments in this figure are shown in Source Data Extended Data Fig. 1.
i, Relative RNA-seq normalized reads of cell cycle-related genes in MCF7 shRB1 cells and MCF7 shLuc cells (n=2 independent cultures) treated with DMSO or abemaciclib.
j,k, Composite profiles of H3K27ac (j) and H3K9me3 (k) ChIP-seq signals at regions of significantly increased ATAC-seq signal in MCF7 and MDA-MB-453 treated with DMSO or abemaciclib for 7 days.
l, Heatmap of H3K27ac ChIP-seq profiles in MCF7 treated with DMSO, abemaciclib, or palbociclib at abemaciclib-induced H3K27ac up-peak regions.
m, Sample-sample correlation between RNA-seq samples of MCF7 and MDA-MB-453 treated with DMSO or abemaciclib (parental: n=3; shRB1: n=2).

