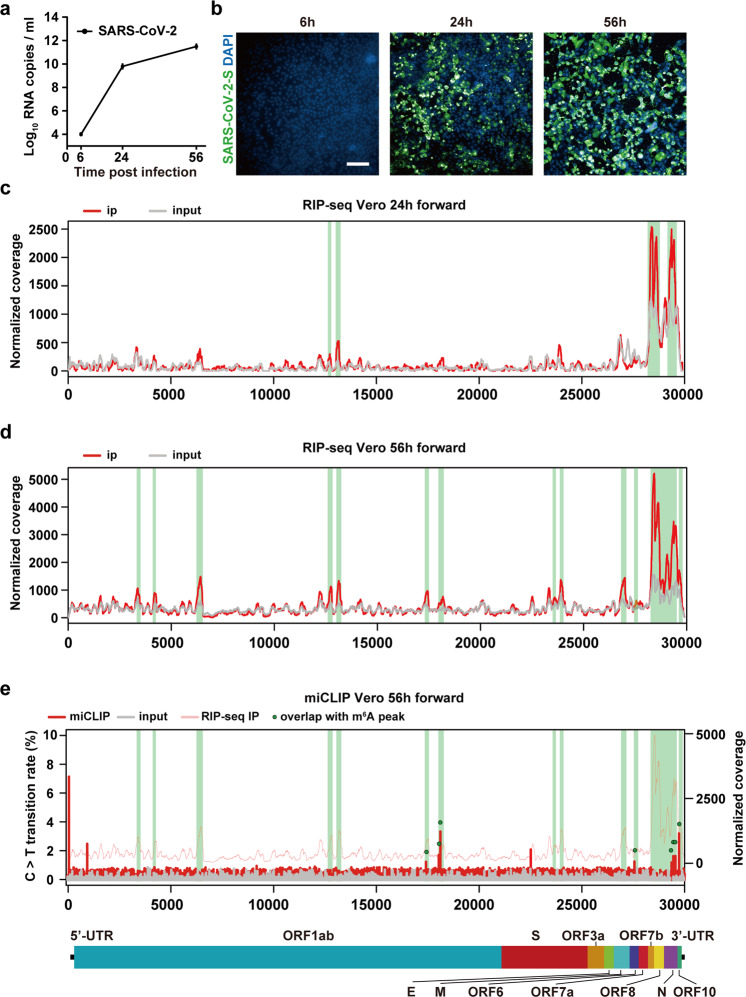
Fig. 1. Landscape of m6A methylome in positive-sense genomic RNA of SARS-CoV-2.
a Vero cells were infected with SARS-CoV-2. Supernatant was harvested 6, 24, 56 h later for quantification of SARS-CoV-2 RNA by qRT-PCR. n = 3. b Representative fields of SARS-CoV-2-infected Vero cells (S protein, green) and nuclei (DAPI, blue) at different time points including 6, 24 and 56 hpi. Scale bar, 20 µm. c, d Refined RIP-seq of SARS-CoV-2 RNA harvested from Vero cells at 24 hpi (c) and 56 hpi (d) showing the distribution of m6A reads mapped to SARS-CoV-2 genome (red line). The gray line represents the baseline signal from input samples, and green rectangles along the x-axis show m6A peaks. Data are representative of n = 2 determinations. e miCLIP revealed m6A sites at single-base resolution across SARS-CoV-2 genome. The ratio of C-to-T transitions of input samples and immunoprecipitation samples of miCLIP, and the distribution of SARS-CoV-2 reads of immunoprecipitation samples by RIP-seq are represented by gray line, red line and pink line, respectively. The green dots show m6A sites that locate within the identified m6A peaks and are identified in both two biological replicates of miCLIP. A schematic diagram of the SARS-CoV-2 genome is shown below to indicate the location of the m6A-enriched sequences.

